








 Web Trader MT5









Key Takeaways
- Investors remain focused on the Federal Reserve after policymakers kept interest rates unchanged while signaling that inflation risks remain elevated, reducing expectations for near-term rate cuts.
- Strong earnings from major technology companies have helped support U.S. equities, although gains have been limited as investors assess whether AI-driven growth can justify elevated valuations.
- Oil prices remain volatile as traders weigh renewed geopolitical tensions involving the United States and Iran against concerns that slower global growth could soften fuel demand.
- Financial markets remain in a consolidation phase, with traders reluctant to take large directional positions ahead of key macroeconomic data and central bank guidance.
US-Iran Tensions Return to the Spotlight
Geopolitical risks re-emerged after tensions between the United States and Iran escalated once again, raising concerns about potential disruptions to oil supplies through the Strait of Hormuz.
The renewed uncertainty initially pushed crude oil prices higher, with traders pricing in a higher geopolitical risk premium. The rise in energy prices also revived concerns that inflation could remain elevated despite recent improvements in U.S. inflation data, making the Federal Reserve’s job even more complicated. Although oil later gave back part of its gains as markets assessed the likelihood of a prolonged disruption, the Middle East remains one of the biggest risks for global markets going into August.
Big Tech Earnings Take Center Stage
The week was dominated by earnings from the Magnificent Seven. Microsoft delivered one of the biggest surprises of the earnings season. Strong Azure cloud growth and continued AI momentum sent the stock soaring more than 15%, adding roughly $450 billion in market value in a single session and lifting the entire technology sector. Meta Platforms disappointed investors despite strong revenue growth. Heavy AI-related capital expenditures and a sharp decline in free cash flow triggered a significant selloff in the stock as investors questioned the pace of spending.
Overall, earnings reinforced that AI remains the primary driver of equity markets, although investors are becoming increasingly selective, rewarding companies showing clear monetization while punishing excessive spending.
Federal Reserve Holds Rates Steady
As widely expected, the Federal Reserve left the federal funds rate unchanged at 3.50%–3.75%. The decision itself had little impact because markets had largely priced it in beforehand. More notable was the split vote, with three FOMC members dissenting, highlighting growing disagreement within the committee.
During his press conference, Fed Chair Kevin Warsh maintained his now-familiar communication style by providing very little forward guidance. Rather than signaling the next policy move, he repeatedly emphasized that future decisions would remain data dependent and that the Fed would act if necessary.
Markets initially interpreted the lack of guidance as hawkish uncertainty rather than dovish reassurance.
Japanese Yen Surges More Than 3%
The Japanese yen recorded its strongest rally in months, appreciating more than 3% against the U.S. dollar after authorities were widely believed to have intervened in the currency market while the Bank of Japan maintained its current policy stance but kept the door open for future tightening. The move triggered a sharp unwind of carry trades and created significant volatility across global foreign exchange markets. The sudden appreciation also reminded investors that Japanese authorities remain willing to act aggressively whenever excessive yen weakness threatens financial stability.
Outlook for Next Week
Several important events could shape market direction:
- Continued Focus on the Middle East
Markets will closely monitor developments between the United States and Iran. Any further escalation could quickly lift oil prices again, adding inflationary pressure and supporting traditional safe-haven assets such as gold.
- More Corporate Earnings
Although the biggest technology names have largely reported, investors will continue digesting earnings from additional companies across healthcare, industrials, consumer sectors, and financials. Guidance for the second half of the year may become even more important than the headline earnings numbers.
- U.S. Economic Data
Investors will focus on fresh economic releases, particularly labor market indicators and services-sector activity, for clues about whether the economy is slowing enough to reduce the likelihood of another Fed rate hike in September.
- Federal Reserve Expectations
Despite holding rates steady this week, markets will continue debating whether the Fed will resume tightening later this year. Every major inflation, employment, or consumer spending report will now have an outsized impact on expectations.
- Currency Markets
Following the sharp appreciation in the Japanese yen, traders will be watching whether Japanese authorities continue supporting the currency and whether the recent carry trade unwind extends into next week.
Major Economic Calendar Events for the Upcoming Week
| Date | Metric | Country | Previous | Time [Dubai] |
| Monday, 3 August | ISM Manufacturing PMI | USA | 53.3 | 6:00 PM |
| Tuesday, 4 August | JOLTS Job Openings | USA | 7.594M | 6:00 PM |
| Wednesday, 5 August | Unemployment Rate | New Zealand | 5.3% | 2:45 AM |
| Wednesday, 5 August | ADP Nonfarm Employment Change | USA | 98K | 4:15 PM |
| Wednesday, 5 August | ISM Services PMI | USA | 54 | 6:00 PM |
| Thursday, 6 August | Unemployment Claims | USA | 4:30 PM | |
| Friday, 7 August | Average Hourly Earnings m/m | USA | 0.3% | 4:30 PM |
| Friday, 7 August | Non-Farm Payrolls | USA | 57K | 4:30 PM |
| Friday, 7 August | Unemployment Rate | USA | 4.2% | 4:30 PM |
| Friday, 7 August | Unemployment Rate | Canada | 6.5% | 4:30 PM |
Technical Analysis and Forecast:
Gold Technical Analysis
Gold remains under pressure on the daily timeframe. Price continues to trade below all three moving averages, with the 5-day, 10-day, and 20-day moving averages maintaining a bearish alignment. Although gold has stabilized around the $4,000-$4,100 area and is trading sideways, the lack of higher highs suggests buyers are still struggling to regain control.
Immediate resistance is located at $4,110-$4,140, followed by the descending 20-day moving average near $4,240. A sustained break above these levels would improve the technical outlook and could trigger a recovery toward $4,350. On the downside, initial support lies around $4,000, with stronger support at the recent low of $3,942. A break below this level would confirm continuation of the broader downtrend and expose lower support levels.
Gold remains below its key moving averages, and the broader trend favors further downside unless buyers reclaim the $4,140-$4,240 resistance zone.
Gold Daily Chart
| Resistance | $4,165 – $4,170 | $4,200 – $4,210 | $4,332 – $4,340 |
| Support | $3,994 – $4,000 | $3,947 – $3,960 | $3,879 – $3,900 |
Brent Technical Analysis
Brent crude remains in a medium-term recovery. However, after reaching the recent swing high near $93.67, bullish momentum has faded and price has entered a corrective phase. Brent is now trading around the 5-day moving average while remaining below the 10-day moving average, although both continue to hold above the rising 20-day moving average. This suggests the longer-term uptrend remains intact despite the current pullback.
Immediate support is located around $86.50-$87.00, which has attracted buying interest in recent sessions. A break below this zone would expose the 20-day moving average near $85.40, followed by stronger support around $82.80. On the upside, initial resistance is seen at $90.30, followed by the recent high near $93.67. A sustained move above $93.67 would signal a resumption of the broader bullish trend and could pave the way toward $97.00.
Brent is undergoing a healthy correction within a broader recovery trend. Holding above the 85.40-86.50 support zone would favor another attempt to retest $90.30 and eventually $93.67.
Brent Daily Chart
| Resistance | $94.31 – $94.45 | $95.60 – $95.72 | $97.25 – $97.40 |
| Support | $87.96 – $88.00 | $86.45 – $86.50 | $84.21 – $84.30 |
Dow Jones Technical Analysis
The Dow Jones remains in a broader uptrend despite the recent pullback from its record high at 53,415. Price continues to consolidate above the major support area around 51,700-52,000, while the 20-day moving average remains upward sloping, suggesting that the longer-term bullish structure is still intact. The short-term moving averages are flattening, reflecting a period of consolidation.
Immediate resistance is located at 53,000, followed by the record high at 53,415. A breakout above this level would confirm trend continuation and open the door for another leg higher. On the downside, the first support lies near 51,700, where buyers have repeatedly entered the market. A break below this zone would expose 50,800, while stronger medium-term support remains near the 20-day moving average around 50,200.
Volume has remained relatively stable during the consolidation phase, suggesting that selling pressure has not intensified significantly. The index continues to produce higher highs and higher lows on the daily timeframe, keeping the broader bullish outlook intact despite the recent sideways movement.
Dow Jones Daily Chart
| Resistance | 52,920 53,000 | 53,328 – 53,350 | 53,560 – 53,600 |
| Support | 51,505 – 51,520 | 51,046 – 51,100 | 50,658 – 50,670 |
USDJPY Technical Analysis
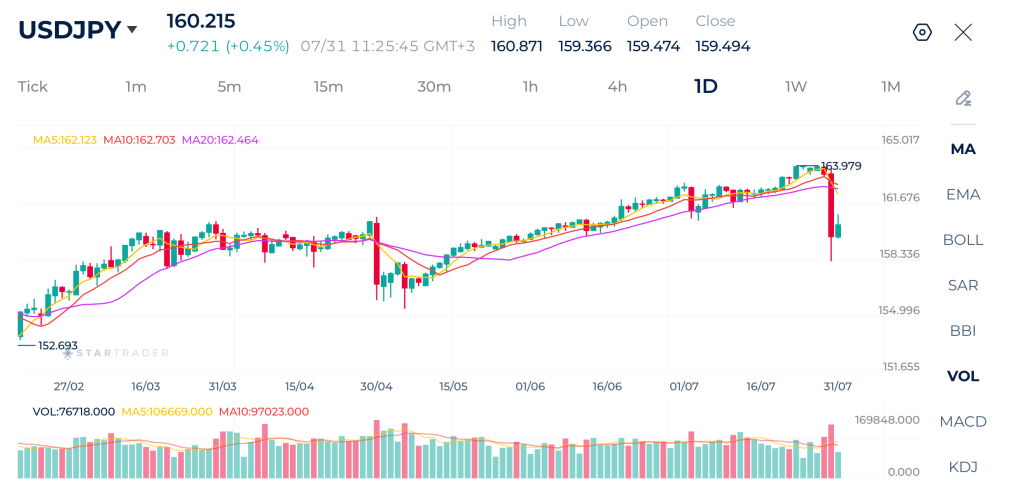
USDJPY has experienced a sharp bearish reversal after failing to sustain its rally above 163.98, triggering an aggressive selloff toward the 158.30 region. The rebound from the daily low has recovered part of the losses, but the pair remains below all three moving averages, indicating that the broader bullish trend has weakened significantly. The 5-day moving average has crossed below the 10-day moving average, while both are now turning lower beneath the 20-day moving average, reflecting increasing downside momentum despite the latest recovery attempt.
Immediate resistance is located around 160.80-161.70, where the short-term moving averages converge. A break above this area would improve the short-term outlook and expose 162.50, followed by the previous peak at 163.98. On the downside, initial support is found at 158.30, with stronger support around 156.50. A daily close below 158.30 would confirm renewed selling pressure and could accelerate losses toward the mid-155.00 region.
USDJPY Daily Chart
| Resistance | 161.10 – 161.18 | 162.82 – 163.00 | 163.95 – 164.00 |
| Support | 159.21 – 159.30 | 158.59 – 158.70 | 157.96 – 158.00 |
Risk Disclaimer: This material is provided for informational purposes only and does not constitute a recommendation or investment advice. Trading financial instruments on margin involves substantial risk and may not be appropriate for all investors.
Tags


Open Live Account
 Email Address
 Phone Number
Important Notice
STARTRADER does not accept any applications from Australian residents.
To comply with regulatory requirements, clicking the button will redirect you to the STARTRADER website operated by STARTRADER PRIME GLOBAL PTY LTD (ABN 65 156 005 668), an authorized Australian Financial Services Licence holder (AFSL no. 421210) regulated by the Australian Securities and Investments Commission.
Important Notice for Residents of the United Arab Emirates
In alignment with local regulatory requirements, individuals residing in the United Arab Emirates are requested to proceed via our dedicated regional platform at startrader.ae, which is operated by STARTRADER Global Financial Consultation & Financial Analysis L.L.C.. This entity is licensed by the UAE Capital Market Authority (CMA) under License No. 20200000241, and is authorised to introduce financial services and promote financial products in the UAE.
Please click the "Continue" button below to be redirected.


