


Key Takeaways
- Oil prices fell back to pre-war levels as progress in the U.S.-Iran peace deal eased concerns over supply disruptions and improved the global supply outlook.
- Gold dropped below $4,000 for the first time since November 2025 after last week’s hawkish Federal Reserve meeting strengthened the U.S. dollar and Treasury yields.
- The U.S. PCE inflation report showed prices continuing to rise, but the data came in largely in line with expectations, reinforcing the Fed’s cautious stance on interest rates.
- Global stock markets ended the week lower, with U.S. and Asian equities pressured by expectations that interest rates will remain higher for longer.
- Micron Technology surged after beating earnings expectations, as strong demand for AI-related memory chips highlighted the resilience of the AI investment theme.
Oil Retreats as Geopolitical Fears Fade
Oil prices extended their decline throughout the week, giving back nearly all of the gains made during the recent conflict. The continued progress in negotiations between the United States and Iran reduced fears of supply disruptions, while expectations that Iranian crude could gradually return to global markets further improved the supply outlook.
Both WTI and Brent crude fell back to levels seen before the conflict, easing inflation concerns across global markets. Crude brent fell 9% during the week to reach $74. WTI lost nearly 10% to end the week around the $70 level. Markets are increasingly pricing in lower geopolitical risk and a more balanced oil market.
Gold Falls Below $4,000
Gold experienced another difficult week, dropping below the psychologically important $4,000 level for the first time since November 2025. The selloff was largely driven by last week’s Federal Reserve meeting, where policymakers signaled that interest rates are likely to remain higher for longer. Higher Treasury yields and a stronger U.S. dollar reduced the appeal of non-yielding assets such as gold, leading investors to continue taking profits after months of record highs. Silver faced a tough week as week, losing 12% to $57 an ounce. Currently, the Fed, not geopolitics, is the dominant driver of gold prices.
Inflation Readings in Line with Expectation
Thursday’s release of the Personal Consumption Expenditures (PCE) Price Index, the Federal Reserve’s preferred inflation measure, showed that inflation continued to rise. However, the figures came in largely in line with market expectations, avoiding a major surprise for investors. Although the data did not significantly alter expectations for monetary policy, it reinforced the view that inflation remains persistent and supports the Fed’s cautious stance on interest rates. Inflation is proving sticky, reducing the likelihood of rate cuts in the near term.
Stocks End the Week Lower
Equity markets struggled globally as investors continued to digest the Fed’s hawkish outlook. U.S. indices finished the week lower, with technology stocks remaining under pressure from higher bond yields. Asian markets also weakened as investors reassessed global growth expectations and tighter financial conditions.
One of the week’s biggest winners was Micron Technology. The semiconductor company reported earnings that comfortably exceeded analyst expectations, driven by exceptionally strong demand for AI-related memory chips. Its optimistic outlook sent shares sharply higher and reinforced confidence that AI-related spending remains one of the strongest themes in global markets despite the broader market weakness. AI demand continues to support semiconductor earnings even as the broader market softens.
Key Economic Data of the week
The market’s attention now shifts to a series of employment reports, culminating in next week’s U.S. jobs data. Strong employment data could reinforce expectations that the Federal Reserve will keep interest rates elevated for longer.
Markets will continue monitoring developments surrounding the peace agreement. Any confirmation regarding sanctions relief, Iranian oil exports, or the reopening of key energy routes could continue influencing oil prices and broader market sentiment.
This week marked a clear shift in market focus. While geopolitical risks eased significantly with progress toward a U.S.-Iran peace agreement, investors became increasingly concerned about the Federal Reserve’s commitment to keeping interest rates higher for longer. The result was lower oil prices, continued weakness in gold, and broad selling across global equity markets. Next week, attention turns squarely to the U.S. labor market, where employment data could determine whether the Fed’s hawkish stance becomes even more firmly entrenched.
Major Economic Calendar Events for the Upcoming Week
| Date | Metric | Country | Previous | Time [Dubai] |
| Monday, 29 June | Retail Sales y/y | Japan | 2.80% | 3:50 AM |
| Tuesday, 30 June | Gross Domestic Product m/m | Canada | -0.10% | 4:30 PM |
| Tuesday, 30 June | JOLTS Job Openings | USA | 7.62m | 6:00 PM |
| Wednesday, 1 July | ADP Non-Farm Employment Change | USA | 122K | 4:15 PM |
| Wednesday, 1 July | ISM Manufacturing PMI | USA | 54 | 6:00 PM |
| Thursday, 2 July | Consumer Price Index m/m | Switzerland | 0.20% | 10:30 AM |
| Thursday, 2 July | Non-Farm Employment Change | USA | 172K | 4:30 PM |
| Thursday, 2 July | Unemployment Rate | USA | 4.30% | 4:30 PM |
| Friday, 3 July | Bank Holiday | USA | NA | All Day |
Technical Analysis and Forecast:
Gold Technical Analysis
Gold remains firmly bearishing in the short term. The precious metal continues to trade below all three moving averages, confirming that sellers maintain full control of the longer-term trend. The MA20 moving average continues to slope lower, highlighting persistent downside momentum.
Price continues to produce lower highs and lower lows. The recent stabilization above $3,960 has failed to generate meaningful upside follow-through, with each recovery attempt quickly attracting renewed selling pressure.
The inability to reclaim the 10-day or 20-day moving averages keeps the bearish trend firmly intact.
Gold remains under significant bearish pressure. As long as price remains below $4,150–$4,295, rallies are likely to be viewed as corrective. A decisive break below $3,959 would strengthen the bearish outlook and open the door for further declines toward $3,900.
Gold Daily Chart
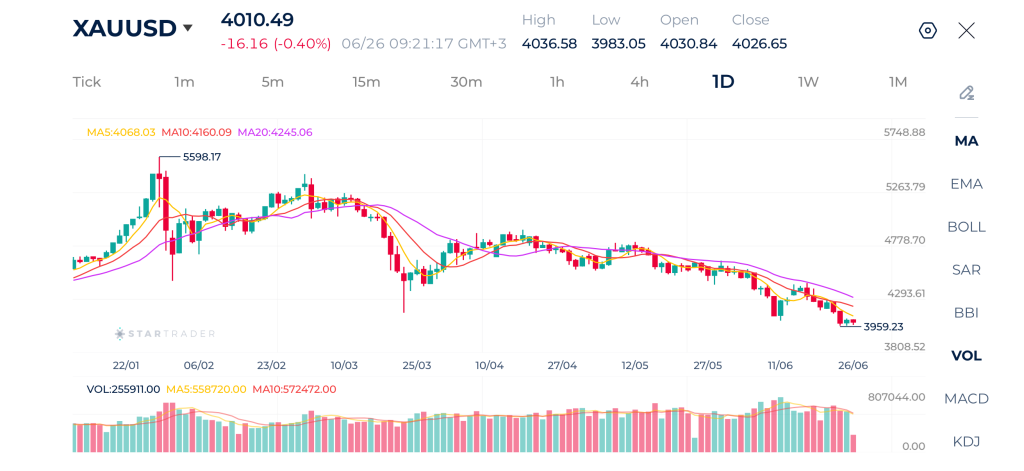
| Resistance | $4,102 – $4,115 | $4,267 – $4,280 | $4,314 – $4,325 |
| Support | $3,950 – $3,966 | $3,889 – $3,900 | $3,794 – $3,800 |
Brent Technical Analysis
Brent crude continues to trade within a pronounced downtrend. Price remains well below the 5-day, 10-day, and 20-day moving averages, confirming that bearish momentum continues to dominate. The long-term moving average is still declining, reflecting persistent weakness in the broader trend. The market continues to register lower highs and lower lows with very limited signs of sustained buying interest.
Although selling pressure has moderated slightly around the $73–$74 region, buyers have been unable to establish a meaningful recovery above nearby resistance levels.
The technical outlook remains bearish while Brent trades below $75–$77. A break below $73.70 would reinforce the current downtrend and expose the $72.00 support zone. Only a sustained recovery above the 20-day moving average would indicate that the bearish trend is beginning to lose momentum.
Brent Daily Chart
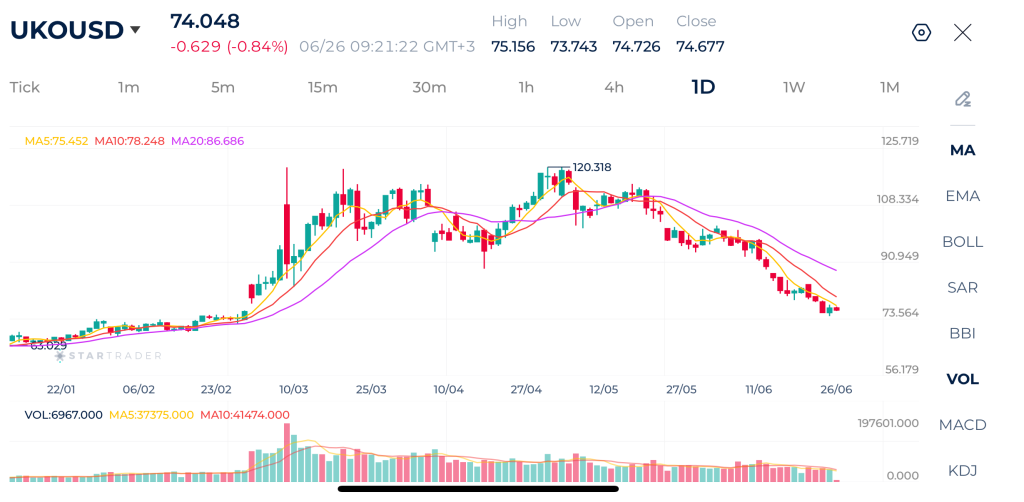
| Resistance | $75.20 $75.55 | $77.00 – $77.35 | $79.85 – $80.20 |
| Support | $72.00 – $72.25 | $70.15 – $70.25 | $69.00 – $69.20 |
S&P 500 Technical Analysis
The S&P 500 has now slipped below the 5-day and 10-day moving averages and is testing the 20-day moving average, indicating that bullish momentum has weakened.
Despite the recent pullback, the broader medium-term trend remains constructive as the index continues to trade well above the major breakout levels established in April and May.
The market has failed to establish new highs following the recent peak, with sellers successfully defending the 7,600–7,630 resistance zone.
Lower daily highs over the past several sessions suggest that momentum is cooling, although no major trend reversal has yet been confirmed.
The broader uptrend remains intact, but short-term momentum has shifted toward consolidation. Holding above 7,300 would maintain the longer-term bullish structure, while a break below this level could trigger a deeper correction toward 7,200 or 7,000.
S&P 500 Daily Chart
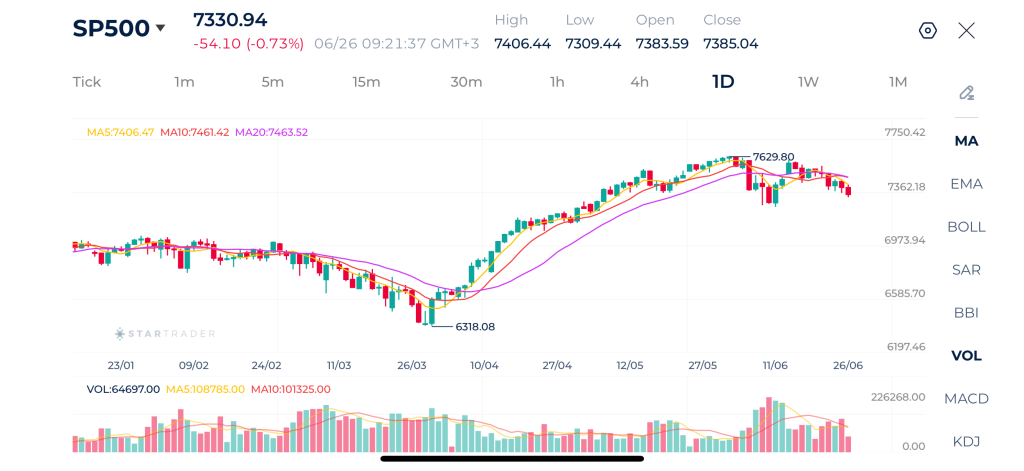
| Resistance | 7,398 – 7,420 | 7,531 – 7,540 | 7,600 – 7,615 |
| Support | 7,290 – 7,300 | 7,190 – 7,200 | 7,047 – 7,060 |
EURUSD Technical Analysis
EURUSD remains in a well-defined bearish trend. Price continues to trade below the 5-day, 10-day, and 20-day moving averages, confirming that sellers remain firmly in control.
The moving averages are bearishly aligned, with the MA5 below the MA10 and both trading beneath the downward-sloping MA20, reflecting persistent downside momentum.
The pair continues to print a sequence of lower highs and lower lows, which remains the defining characteristic of the current trend.
Although today’s candle shows a modest bounce from the recent low, the recovery lacks momentum and appears to be a technical rebound rather than the beginning of a broader reversal. Daily volume has also eased, suggesting limited buying conviction.
The outlook remains bearish while price remains below 1.1450–1.1515. A break below 1.1324 would expose 1.1300 and potentially 1.1250, while only a sustained recovery above the 20-day moving average would begin to neutralize the current downtrend.
EURUSD Daily Chart
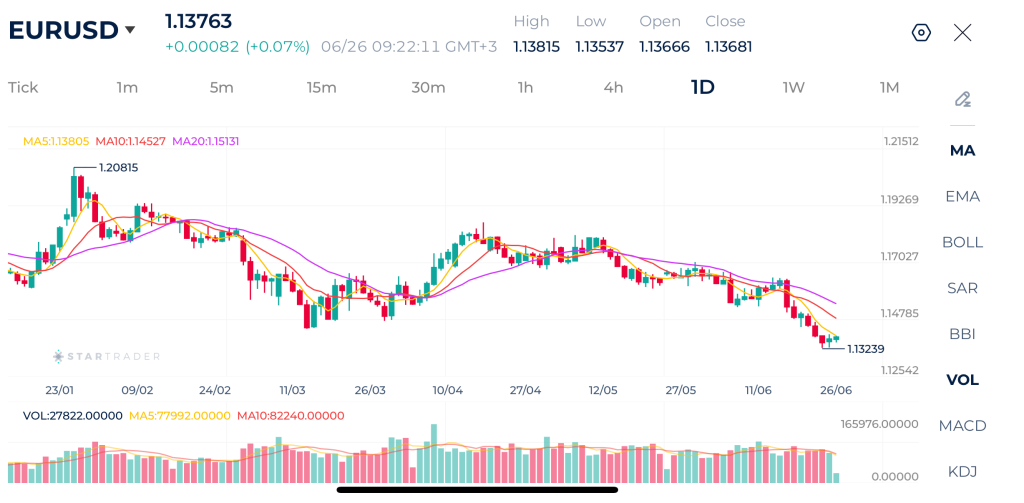
| Resistance | 1.1410 – 1.1423 | 1.1463 – 1.1480 | 1.1500 – 1.1513 |
| Support | 1.1300 – 1.1312 | 1.1208 – 1.1262 | 1.1133 – 1.1150 |
Risk Disclaimer: This material is provided for informational purposes only and does not constitute a recommendation or investment advice. Trading financial instruments on margin involves substantial risk and may not be appropriate for all investors.
Tags
Open Live Account
Please enter a valid country
No results found
No results found
Please enter a valid email
Please enter a valid verification code
1. 8-16 characters + numbers (0-9) 2. blend of letters (A-Z, a-z) 3. special characters (e.g, !a#S%^&)
Please enter the correct format
Please tick the checkbox to proceed
Please tick the checkbox to proceed
Important Notice
STARTRADER does not accept any applications from Australian residents.
To comply with regulatory requirements, clicking the button will redirect you to the STARTRADER website operated by STARTRADER PRIME GLOBAL PTY LTD (ABN 65 156 005 668), an authorized Australian Financial Services Licence holder (AFSL no. 421210) regulated by the Australian Securities and Investments Commission.
CONTINUEImportant Notice for Residents of the United Arab Emirates
In alignment with local regulatory requirements, individuals residing in the United Arab Emirates are requested to proceed via our dedicated regional platform at startrader.ae, which is operated by STARTRADER Global Financial Consultation & Financial Analysis L.L.C.. This entity is licensed by the UAE Capital Market Authority (CMA) under License No. 20200000241, and is authorised to introduce financial services and promote financial products in the UAE.
Please click the "Continue" button below to be redirected.
CONTINUEError! Please try again.

