








 Web Trader MT5









Key Takeaways
- A temporary ceasefire between the U.S. and Iran was announced, shifting market sentiment from extreme risk-off to cautious optimism.
- Oil prices dropped sharply following the ceasefire, but slightly bounced back as doubts emerged about its durability.
- Global stock markets rebounded strongly, recovering from prior losses as risk sentiment improved.
- Gold and silver moved higher overall, benefiting from a weaker US dollar.
- The U.S. dollar weakened, with the DXY declining as investors shifted toward risk assets.
- Major currencies strengthened, supported by the pullback in the dollar.
- Crypto markets remained resilient, showing modest gains as risk appetite improved.
Stocks and Global Markets Rebound on Ceasefire Hopes
Global equity markets staged a strong recovery during the week, driven by optimism following the announcement of a ceasefire between the U.S. and Iran. After weeks of heavy selling and correction, investors quickly rotated back into risk assets.
U.S. indices rebounded sharply, with the Dow Jones and S&P 500 posting multiple consecutive gains, supported by easing fears of a prolonged conflict.
The rally was largely sentiment driven. Markets reacted positively to the possibility of reduced energy prices and lower inflation pressure. However, gains were not entirely stable, as concerns about the fragility of the ceasefire continued to create intraday volatility.
Dow Jones rose more than 4% during the week, breaking above 48,300 again. Nasdaq 100 recaptured 25,000 level gaining 5% during the week. S&P 500 rose 4.5% and ended the week near the 6,800 level.
Globally, Asian and European markets followed the same pattern, with risk appetite improving but remaining highly sensitive to geopolitical headlines.
Sharp Drop in Oil Prices
Oil experienced extreme volatility, making it once again the central driver of global markets. Following the ceasefire announcement, oil prices plunged sharply, with crude brent losing 10% and dropping below $90 as the geopolitical risk premium was quickly priced out.
However, the decline did not last long. As doubts about the ceasefire emerged, particularly around continued restrictions in the Strait of Hormuz, oil prices rebounded toward the $98–$100 range. Brent ended the week near the $95 level.
Markets are now pricing a balance between potential de-escalation, ongoing supply risks, and uncertainty around enforcement of the ceasefire This has created a highly unstable environment where oil reacts aggressively to every headline.
Gold and Silver Benefit from a Weaker Dollar
Gold and silver traded with a slight upward bias during the week, thanks to a strong decline in the US dollar.
Gold remained within a broad range, supported by ongoing geopolitical uncertainty, inflation concerns, and portfolio hedging. The precious metal rose 2% during the week, reaching $4,850 at one point before retracing to $4,750. Silver followed a similar pattern but with higher volatility as it ended the week almost 4% higher.
Precious metals are not reacting as risk-off assets during this conflict. They are now reacting to a mix of USD movements, yields, and geopolitics.
Dollar Weakness Pushed Major Currencies Higher
The forex market saw a clear shift away from the U.S. dollar during the week. Following the ceasefire announcement, the DXY declined, as safe-haven demand for USD eased and capital rotated into higher-risk currencies. The Dollar Index dropped to 98.50 on Wednesday before settling around 99.00 toward the end of the week.
As a result, EURUSD rose 1.8%, supported by improved global sentiment, GBPUSD strengthened more than 2%, benefiting from USD weakness, and risk-sensitive currencies gained, reflecting broader optimism
Crypto Market Resilient with Mild Upside
The cryptocurrency market showed resilience during the week, benefiting from improving risk appetite.
Bitcoin traded in the $66,000–$70,000 range, briefly pushing higher during periods of strong risk-on sentiment.
However, the upside remained limited, as uncertainty around geopolitics and monetary policy continued to cap strong bullish momentum.
Outlook for Next Week (13–17 April 2026)
Key Themes to Watch:
- Ceasefire stability: Markets will be highly sensitive to any confirmation or breakdown of the ceasefire. This remains the single most important driver. Continued volatility is expected in oil prices. If the ceasefire proved stable, prices could face downside pressure. However, renewed tensions may lead to sharp upside moves
- Stocks: Momentum may continue if risk sentiment holds, but rallies remain fragile and headline dependent.
- USD (USDX): Further downside in the US dollar is possible if risk appetite improves, but support remains if inflation concerns persist. Gold and silver are likely to remain supported by the weak dollar. The crypto market may continue to stabilize, with upside depending on sustained improvement in risk sentiment.
Major Economic Calendar Events for the Upcoming Week
| Date | Metric | Country | Previous | Time [Dubai] |
| Monday, 13 April | Existing Home Sales | USA | 4.09M | 6:00 PM |
| Tuesday, 14 April | Producer Price Index m/m | USA | 0.70% | 4:30 PM |
| Wednesday, 15 April | Empire State Manufacturing Index | USA | -0.2 | 4:30 PM |
| Wednesday, 15 April | Crude Oil Inventories | USA | 3.1M | 6:30 PM |
| Wednesday, 15 April | Beige Book | USA | 10:00 PM | |
| Thursday, 16 April | Unemployment Rate | Australia | 4.30% | 5:30 AM |
| Thursday, 16 April | Gross Domestic Product m/m | UK | 0.00% | 10:00 AM |
| Thursday, 16 April | Philly Fed Manufacturing Index | USA | 18.1 | 4:30 PM |
| Thursday, 16 April | Unemployment Claims | USA | 0.90% | 10:00 AM |
| Friday, 17 April | FOMC Financial Stability Report | USA | Tentative |
Technical Analysis and Forecast:
Brent Technical Analysis
Brent shows a clear loss of direction following the recent spike above $110. Price then faced multiple rejections and formation of lower highs. Price is now consolidating below resistance, around $108–$110, with moving averages starting to flatten. This suggests a transition into a range or mild correction.
A break below $100 would confirm deeper downside, while reclaiming $110 would revive bullish momentum.
Brent Daily Chart
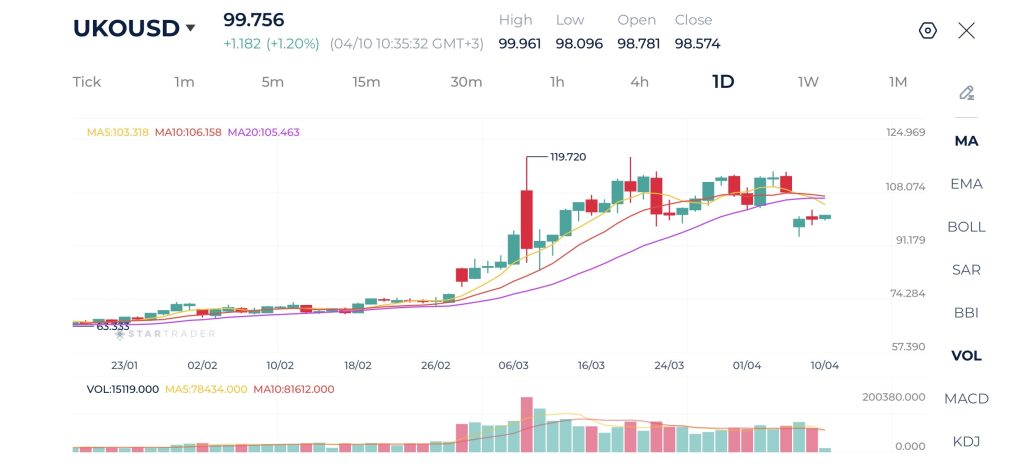
| Resistance | $102.72 – $102.96 | $107.82 – $108.00 | $114.31 – $114.56 |
| Support | $92.83 – $93.00 | $87.56 – $87.82 | $85.12 – $85.67 |
Dow Jones Technical Analysis
The Dow Jones is showing a strong recovery from the 44,800 lows we say at the end of March, forming higher highs and higher lows. Price has reclaimed key moving averages, indicating a shift from bearish to early bullish trend structure. However, the market is now approaching resistance near 48,200, where momentum is slowing slightly
As long as price holds above 47,000–47,200, the bullish outlook remains intact, with potential continuation higher.
Dow Jones Daily Chart
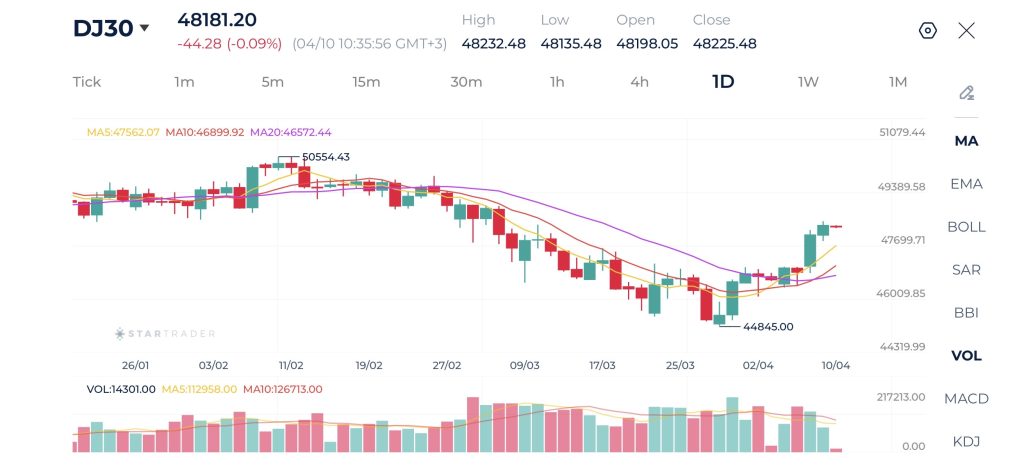
| Resistance | 48,721 – 48,750 | 49,331 – 49,367 | 49,914 – 49,971 |
| Support | 47,363 – 47,391 | 46,906 – 46,954 | 46,780 – 46,824 |
Gold Technical Analysis
Gold is currently in a stabilization phase after a sharp correction from the highs. Price found support near $4,550 recently and has since recovered toward the $4,750 area, where it is now consolidating. The structure is transitioning from bearish to neutral, with price holding above short-term moving averages.
A break above $4,800 would signal renewed bullish momentum, while holding above $4,650 keeps the recovery intact.
Gold Daily Chart
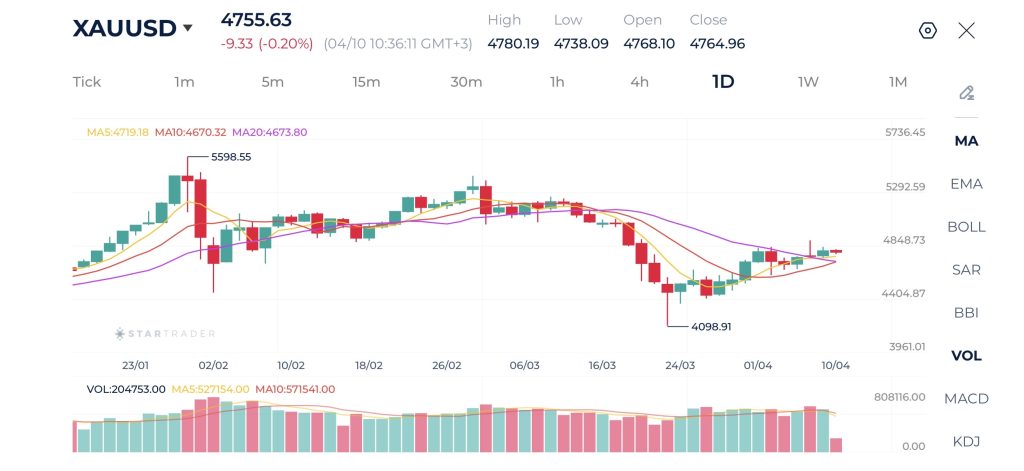
| Resistance | $4,858 – $4,870 | $4,971 – $4,990 | $5,000 – $5,010 |
| Support | $4,600 – $4,610 | $4,526 – $4,530 | $4,421 – $4,435 |
US Dollar Index (USDX) Technical Analysis
The USD Index shows signs of weakness after failing to sustain above the 100 level, forming a lower high near 100.48. Price is now drifting lower and trading around key moving averages, which are starting to flatten. This indicates a loss of bullish momentum and a shift toward a neutral-to-bearish structure.
As long as the dollar remains below 99.50–100, downside pressure could persist toward the 98 and 97.50 zones.
DXY Daily Chart
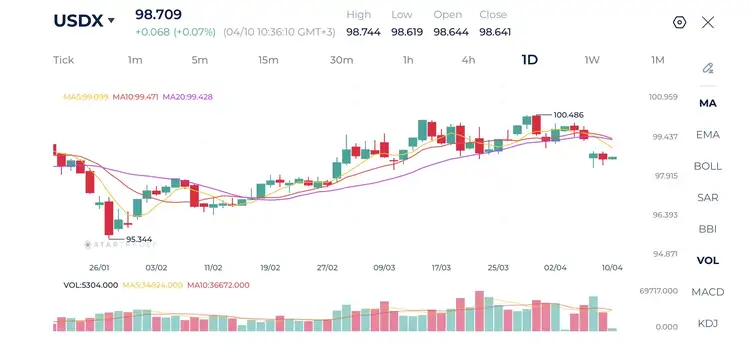
| Resistance | 99.50 – 99.62 | 100.00 – 100.20 | 100.78 – 100.92 |
| Support | 98.48 – 98.56 | 98.00 – 9.812 | 97.36 – 9.750 |
Risk Disclaimer: This material is provided for informational purposes only and does not constitute a recommendation or investment advice. Trading financial instruments on margin involves substantial risk and may not be appropriate for all investors.
Tags


Open Live Account
 Email Address
 Phone Number
Important Notice
STARTRADER does not accept any applications from Australian residents.
To comply with regulatory requirements, clicking the button will redirect you to the STARTRADER website operated by STARTRADER PRIME GLOBAL PTY LTD (ABN 65 156 005 668), an authorized Australian Financial Services Licence holder (AFSL no. 421210) regulated by the Australian Securities and Investments Commission.
Important Notice for Residents of the United Arab Emirates
In alignment with local regulatory requirements, individuals residing in the United Arab Emirates are requested to proceed via our dedicated regional platform at startrader.ae, which is operated by STARTRADER Global Financial Consultation & Financial Analysis L.L.C.. This entity is licensed by the UAE Capital Market Authority (CMA) under License No. 20200000241, and is authorised to introduce financial services and promote financial products in the UAE.
Please click the "Continue" button below to be redirected.


