








 Web Trader MT5









Key Takeaways
- Oil prices remained elevated above $110 as the Iran war intensified, with direct attacks on energy infrastructure in Qatar and the Gulf.
- Gold and silver declined sharply despite geopolitical tensions, as a strong U.S. dollar and rising inflation fears pressured prices.
- U.S. and global stocks fell amid rising inflation expectations driven by higher energy prices.
- Major central banks held rates unchanged, signaling caution due to uncertainty from the war and inflation risks.
- The U.S. dollar remained strong, acting as the primary safe haven instead of precious metals.
Oil Market Elevated Prices Driven by War Developments
Oil markets remained the central driver of global financial movements during the week. Prices stayed elevated above $110–$114 per barrel, supported by continued escalation in the Middle East conflict.
The key development was Iran targeting major energy infrastructure, including Qatar’s LNG facilities, one of the most critical global energy hubs. This raised serious concerns about supply disruptions, especially given that around 20% of global oil flows through the Strait of Hormuz.
At the same time, markets faced conflicting forces. While geopolitical risks pushed prices higher, discussions around strategic reserve releases and potential military stabilization attempts prevented oil from making an uncontrolled breakout. Still, the overall trend remains bullish, with oil acting as the main inflation trigger across global markets.
Gold and Silver Decline Under Strong Dollar Pressure
Despite the ongoing war, normally a bullish catalyst, gold and silver declined during the week, marking a shift in safe haven dynamics. Gold dropped toward $4,500, while silver fell near $65, both hitting multi week lows.
The primary reason behind this decline was the strength of the U.S. dollar, which absorbed most of the safe-haven demand. As inflation expectations rose due to higher oil prices, markets began pricing in fewer rate cuts, increasing real yields and reducing the attractiveness of non-yielding assets like gold.
This reflects a key market shift, instead of traditional hedging through precious metals, investors are increasingly moving toward cash (USD) in times of uncertainty. As long as the dollar remains strong and rate cuts are delayed, precious metals may continue to face pressure despite geopolitical support.
U.S. Stocks and Global Indices Slide on Inflation Fears
Equity markets experienced a broad sell-off during the week, with U.S. indices under pressure due to rising oil prices and inflation concerns.
Higher energy prices are directly feeding into inflation expectations, raising concerns that central banks may need to maintain tighter monetary policy for longer. This negatively impacts equity valuations, particularly growth stocks that are sensitive to interest rates.
Globally, markets reacted similarly. European indices declined, while risk sentiment weakened across Asia as well. The combination of geopolitical risk and inflation shock created a classic risk-off environment, pushing investors away from equities and into safer assets.
The forex market was dominated by U.S. dollar strength, supported by both safe-haven demand and shifting interest rate expectations.
Continued strength in the US dollar Against Major Currencies
During the week, several major central banks, including the Federal Reserve, ECB, and Bank of England, kept interest rates unchanged, highlighting the uncertainty created by the war and its inflationary impact.
- The Federal Reserve signaled a more cautious outlook, with fewer expected rate cuts.
- The ECB maintained rates at 2.15%, emphasizing data dependency.
- The Bank of England also held steady but warned about inflation risks from energy prices.
As a result, the dollar index (DXY) remained near highs around 100, EURUSD stayed under pressure, and the Japanese Yen weakened against USD despite its safe-haven status
Major Economic Calendar Events for the Upcoming Week
| Date | Metric | Country | Previous | Time [Dubai] |
| Monday, 23 March | Consumer Confidence | Euro | -12 | 7:00 PM |
| Tuesday, 24 March | Flash Manufacturing PMI | UK | 51.7 | 1:30 PM |
| Tuesday, 24 March | Flash Services PMI | UK | 53.9 | 1:30 PM |
| Tuesday, 24 March | Flash Manufacturing PMI | USA | 51.6 | 5:45 PM |
| Tuesday, 24 March | Flash Services PMI | USA | 51.7 | 5:45 PM |
| Wednesday, 25 March | Consumer Price Index y/y | Australia | 3.80% | 4:30 AM |
| Wednesday, 25 March | Consumer Price Index y/y | UK | 3.00% | 11:00 AM |
| Thursday, 26 March | Unemployment Claims | USA | 4:30 PM | |
| Friday, 27 March | Retail Sales m/m | UK | 1.80% | 11:00 AM |
Technical Analysis and Forecast:
Brent Technical Analysis
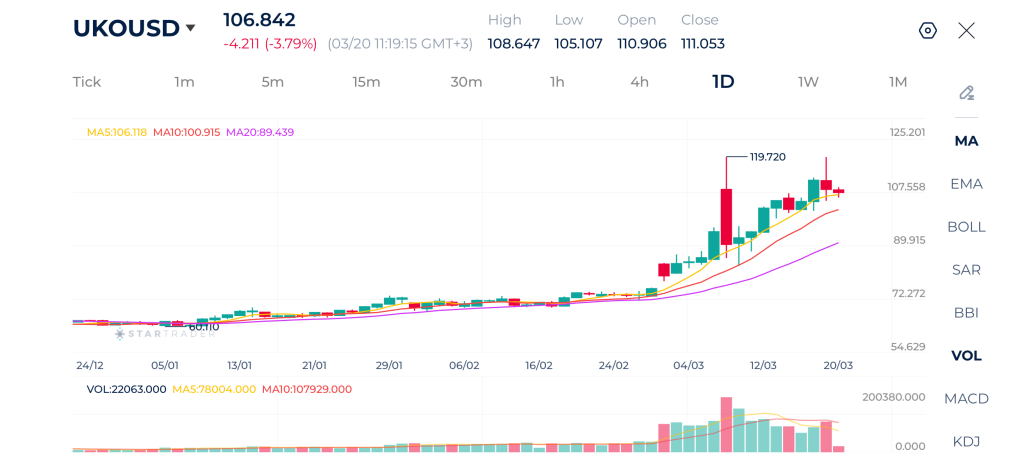
Oil is currently trading around $106.80, as the daily chart shows a strong bullish trend, although recent price action suggests a potential short-term correction after an extended rally.
The broader structure remains bullish, with a sequence of higher highs and higher lows, especially after the breakout above $100.00.
The moving averages are still bullishly aligned, with MA5 above MA10, and both above MA20, while price remains above MA30. However, the flattening of shorter-term averages suggests that momentum is slowing.
From a technical standpoint, $108–$110 now acts as resistance, while $100–$102 is the key support zone. If price holds above this support, the bullish trend remains intact. However, a break below $100 would signal a deeper correction toward $95.
Brent Daily Chart
| Resistance | $109.91 – $110.20 | $113.70 – $114.00 | $116.57 – $117.00 |
| Support | $97.55 – $97.70 | $93.00 – $93.25 | $91.00 – $91.25 |
Gold Technical Analysis
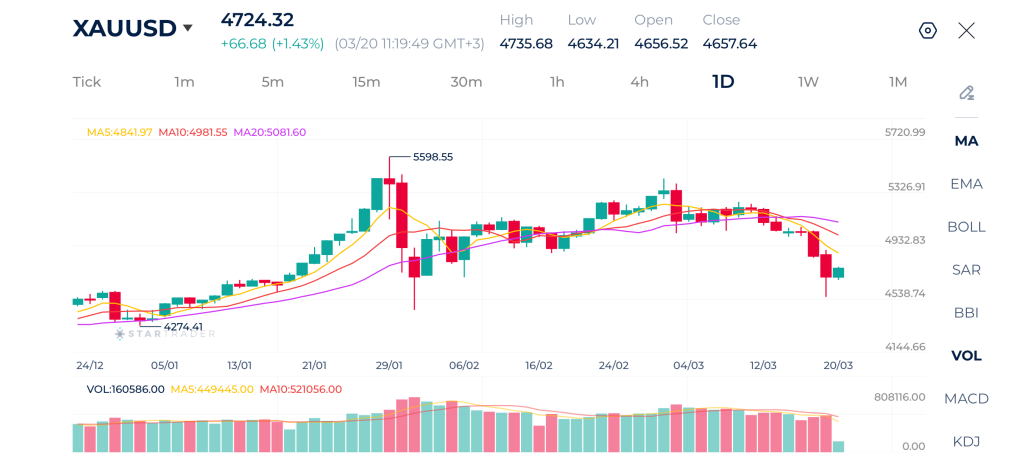
Gold is currently trading around $4,720, and the chart clearly shows a major trend transition from bullish to bearish for the short term.
Price is now forming a sequence of lower highs and lower lows, confirming a shift into a medium-term downtrend. The most recent move shows a weak bounce attempt after tapping the $4,530–$4,600 support zone, but the recovery lacks strong follow through, indicating that buyers are still not in control.
The moving averages reinforce this bearish outlook. The MA5 is below MA10, and both are below MA20, while the MA30 remains above price and sloping downward. This alignment reflects sustained selling pressure, with rallies likely to be corrective rather than trend-changing.
From a key levels perspective, $4,800–$4,900 is now a strong resistance zone, aligned with the moving averages and previous consolidation. As long as price remains below this area, the bearish bias remains intact. On the downside, $4,600 is critical support, and a break below it could accelerate the move toward $4,450–$4,400.
Gold Daily Chart
| Resistance | $4,780 – $4,800 | $4,875 – $4,900 | $5,000 – $5,020 |
| Support | $4,500 – $4,520 | $4,400 – $4,420 | $4,270 – $4,300 |
Dow Jones Technical Analysis
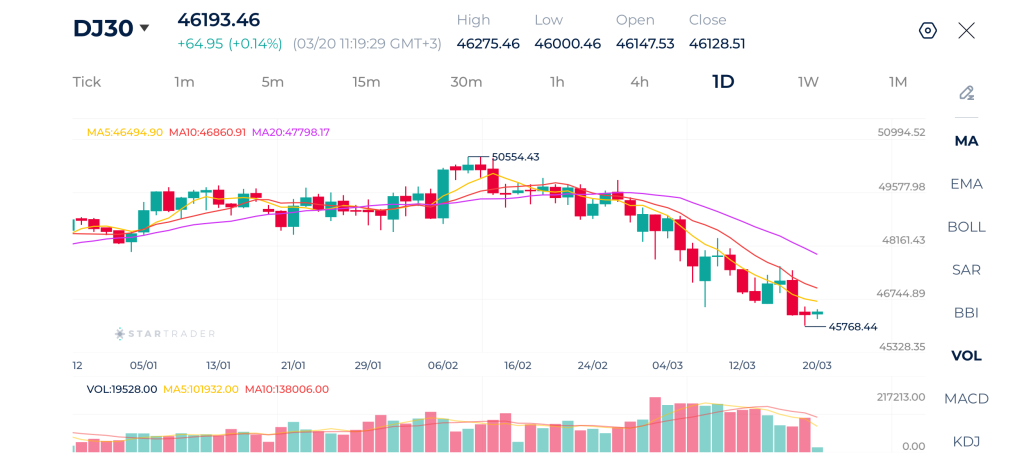
The Dow is trading near 46,200 as the market is shifting into a bearish structure with strong downside momentum.
Price action is now characterized by consistent lower highs and lower lows, confirming that sellers are in control. The recent bounce from 45,700–46,000 appears corrective, as it lacks strong bullish momentum and is already facing resistance.
The moving averages confirm this bearish trend. The MA5 and MA10 are below MA20, and all are turning downward. Price is also trading below the MA30, which signals a broader trend shift rather than a short-term pullback.
Technically, 46,800–47,500 is the main resistance zone. On the downside, 45,700 remains key support, and a break below it could open the door toward 44,500.
Dow Jones Daily Chart
| Resistance | 47,000 – 47,100 | 47,400 – 47,426 | 47,730 – 47,800 |
| Support | 45,700 – 45,720 | 45,236 – 45,260 | 45,000 – 45,060 |
EURUSD Technical Analysis
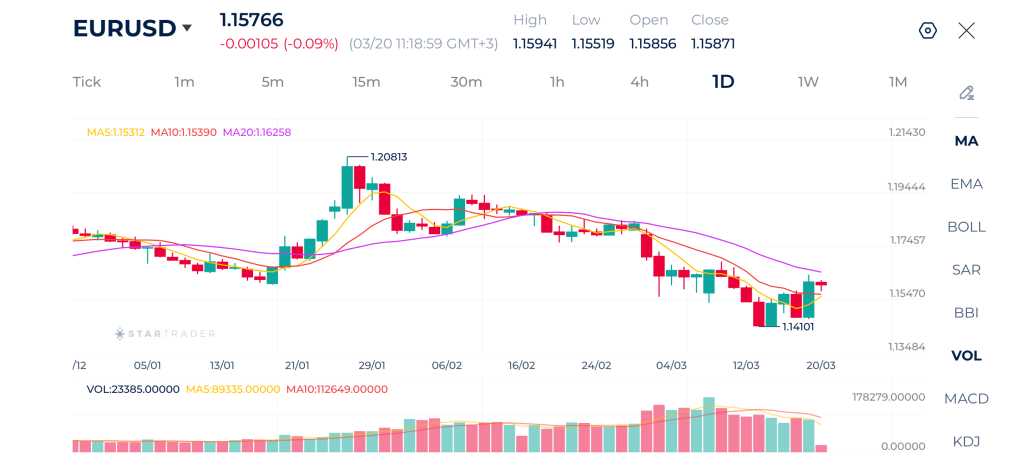
EURUSD is trading around 1.1576, and the chart shows a clear bearish trend continuation after failing to sustain gains above the 1.2000 region. The rejection from 1.2080 marked the start of a strong downward move.
The structure is firmly bearish, with price forming lower highs and lower lows. The recent bounce from 1.1400 support appears weak and corrective, suggesting that the broader trend remains to the downside.
The moving averages support this view. The MA5 and MA10 are below MA20, and price is trading below the MA30, indicating sustained bearish momentum. The slope of all moving averages is also downward, reinforcing trend continuation.
Key levels show that 1.1650–1.1700 is immediate resistance, while 1.1400 is key support. A break below this level would likely accelerate the decline toward 1.1250.
EURUSD Daily Chart
| Resistance | 1.1667 – 1.1680 | 1.1742 – 1.1755 | 1.1832 – 1.1850 |
| Support | 1.1445 – 1.1460 | 1.1380 – 1.1400 | 1.1286 – 1.1300 |
Risk Disclaimer: This material is provided for informational purposes only and does not constitute a recommendation or investment advice. Trading financial instruments on margin involves substantial risk and may not be appropriate for all investors.
Tags


Open Live Account
 Email Address
 Phone Number
Important Notice
STARTRADER does not accept any applications from Australian residents.
To comply with regulatory requirements, clicking the button will redirect you to the STARTRADER website operated by STARTRADER PRIME GLOBAL PTY LTD (ABN 65 156 005 668), an authorized Australian Financial Services Licence holder (AFSL no. 421210) regulated by the Australian Securities and Investments Commission.
Important Notice for Residents of the United Arab Emirates
In alignment with local regulatory requirements, individuals residing in the United Arab Emirates are requested to proceed via our dedicated regional platform at startrader.ae, which is operated by STARTRADER Global Financial Consultation & Financial Analysis L.L.C.. This entity is licensed by the UAE Capital Market Authority (CMA) under License No. 20200000241, and is authorised to introduce financial services and promote financial products in the UAE.
Please click the "Continue" button below to be redirected.


