








 Web Trader MT5









Key Takeaways
- Brent crude climbed above $100 as attacks on Saudi tankers and restricted traffic through the Strait of Hormuz intensified supply concerns.
- Rising oil prices pushed Treasury yields and the dollar higher, while markets increased expectations that the Federal Reserve may need to raise rates.
- U.S. technology stocks came under pressure after Alphabet and Tesla’s results renewed concerns about the cost and cash-flow impact of heavy AI investment.
- Gold reversed from a two-week high above $4,160 and moved back toward $4,030 as higher yields and a stronger dollar outweighed safe-haven demand.
- The ECB kept its deposit rate at 2.25% but left the door open to further tightening if the energy shock continues.
US Equities: Oil and Geopolitics Weigh on Technology Stocks
Wall Street began the week cautiously as investors monitored developments in the Middle East and prepared for major technology earnings. Semiconductor shares initially recovered, helping the Nasdaq stabilise after the previous week’s sell-off.
Sentiment improved temporarily on Tuesday and Wednesday, supported by a rebound in chip stocks and expectations that strong corporate investment in artificial intelligence would continue supporting semiconductor and data-centre demand.
That recovery reversed sharply on Thursday. Alphabet and Tesla fell after their quarterly results raised concerns about the amount of cash required to fund AI infrastructure.
Oil-related pressures added to the weakness. Higher energy prices pushed Treasury yields upward and increased the discount rate applied to highly valued growth stocks. Strong Intel results offered limited relief on Friday as traders remained focused on oil, yields, and next week’s Federal Reserve meeting.
Gold and Oil: Energy Shock Dominates the Week
Brent crude was the week’s strongest major market mover. Prices rose from $89.22 on Monday to above $100 by Friday after gaining 2% on Tuesday, 3.4% on Wednesday, and 7% on Thursday. Brent briefly reached $102, its highest level in two months.
Gold moved in the opposite direction by the end of the week. The precious metal climbed from below $4,000 to a two-week high of $4,166 on Wednesday as geopolitical tensions supported safe-haven demand. The metal then fell around 2% on Thursday and extended its decline toward $4,030 on Friday.
The reversal showed that rising Treasury yields and tighter Federal Reserve expectations were having a stronger effect than geopolitical demand. Gold therefore ended the week under renewed pressure.
Forex: Dollar Strength Returns as Yields Rise
The U.S. dollar strengthened toward a three-week high as the oil surge increased inflation concerns and pushed Treasury yields higher.
EUR/USD began the week near 1.1430 but fell to a weekly low of 1.1364 on Thursday after the ECB left rates unchanged and the dollar strengthened. The pair recovered slightly toward 1.1384 on Friday but remained below its earlier weekly levels.
The ECB kept its deposit rate at 2.25% but said it was monitoring the intensity, duration, and indirect effects of the energy shock. Markets continue to expect further tightening if elevated oil and gas prices persist.
Forecast: Week of July 27–31
Next week is likely to be driven by the Federal Reserve, U.S. growth and inflation data, oil prices, and another heavy round of technology earnings.
The Federal Reserve meets on July 28–29. The immediate rate decision will be important, but traders are likely to focus more closely on how policymakers assess the inflationary impact of oil above $100. A more hawkish message could push Treasury yields and the dollar higher while maintaining pressure on technology stocks and gold.
U.S. second-quarter GDP and June Personal Income and Outlays, including the PCE inflation figures, will be released on July 30. Strong growth or higher inflation could reinforce expectations of tighter policy, while weaker readings could reduce rate-hike pricing.
Microsoft and Meta report after the U.S. close on July 29, followed by Amazon on July 30. Traders will focus on cloud growth, AI demand, infrastructure expenditure, margins, and free cash flow after this week’s negative reaction to Alphabet and Tesla.
Brent retains a bullish near-term bias while the threat to regional shipping remains unresolved. Holding above $100 would keep inflation and rate expectations elevated. A credible ceasefire or improvement in tanker traffic could trigger a sharp correction.
Gold is likely to remain sensitive to yields. Continued trading below the short-term daily moving averages would keep the outlook under pressure, while a decline in oil prices or a less hawkish Fed could support a recovery.
EUR/USD may remain pressured while the dollar is supported by higher U.S. yields. The pair would require a sustained recovery above the 1.1400–1.1420 area to improve the broader technical outlook.
Major Economic Calendar Events for the Upcoming Week
| Date | Event | Market | Time—Dubai |
| Monday, 27 July | Durable Goods Orders | USA | 4:30 PM |
| Wednesday, 29 July | Federal Reserve Interest Rate Decision | USA | 10:00 PM |
| Wednesday, 29 July | FOMC Press Conference | USA | 10:30 PM |
| Thursday, 30 July | Q2 GDP—Advance Estimate | USA | 4:30 PM |
| Thursday, 30 July | Personal Income and Outlays / PCE | USA | 4:30 PM |
| Friday, 31 July | Employment Cost Index | USA | 4:30 PM |
Technical Analysis and Forecast
Gold Technical Analysis
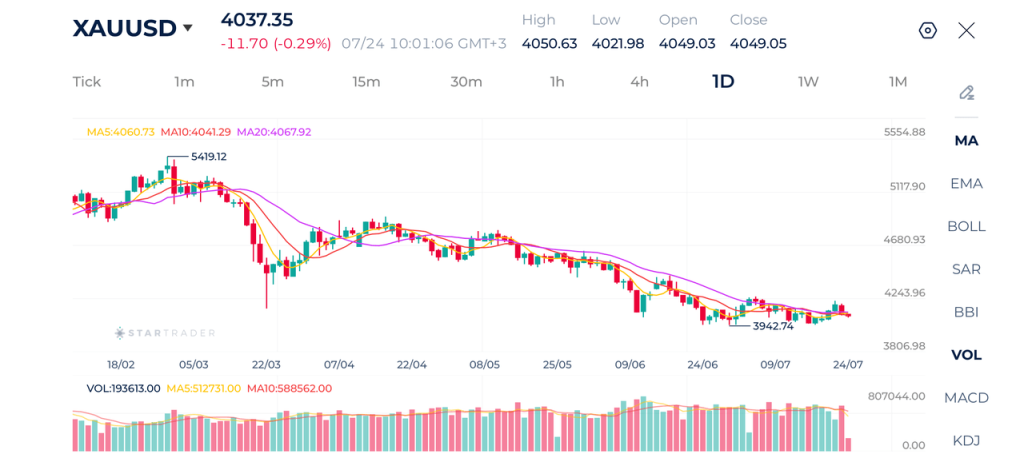
Gold has returned to a bearish daily structure after failing to hold Wednesday’s recovery above $4,100. XAU/USD is trading near $4,029, below the 5-day moving average at $4,035, the 10-day average at $4,042, and the 20-day average at approximately $4,054. This confirms that sellers have regained control of the short-term trend.
Immediate resistance is located around the 5-day average near $4,035, followed by $4,042 and the stronger 20-day average near $4,054. Initial support is located near Friday’s low of $4,023, followed by $4,000 and Monday’s low near $3,983.
A recovery above $4,054 would be required to ease the current bearish structure. A sustained break below $4,000 would increase the risk of another move toward $3,983.
Gold Daily Chart
| Level 1 | Level 2 | Level 3 | |
| Resistance | $4,160 – $4,175 | $4,240 – $4,255 | $4,360 – $4,372 |
| Support | $4,000 – $4,023 | $3,923 – $3,945 | $3,822 – $3,840 |
Brent Technical Analysis
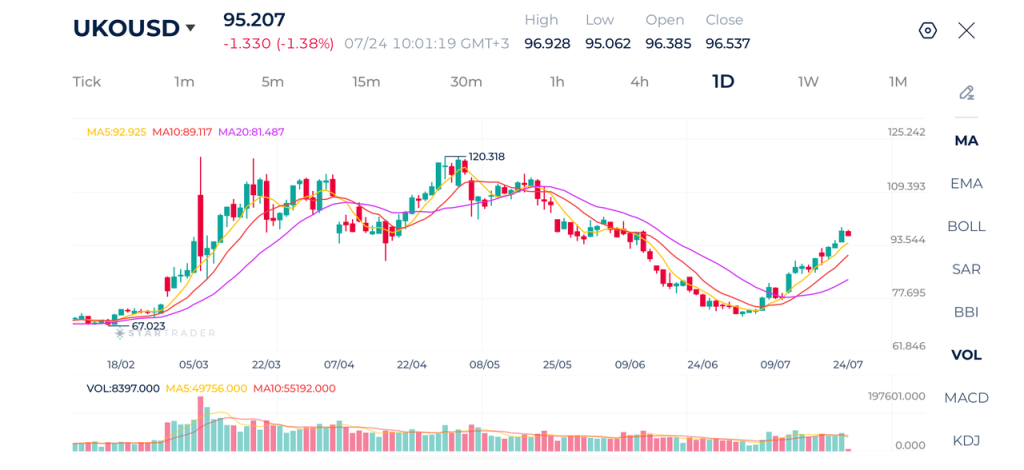
Brent remains in a strong daily uptrend after rising from below $90 to a high of $102 during the week. Price continues to trade above the 20-, 50-, and 100-day moving averages, confirming that buyers remain in control despite Friday’s consolidation.
Immediate resistance is located at Friday’s high near $101.16, followed by the weekly peak at $102. Initial support is located around the 20-day moving average at $99.90. Stronger support is found around the 50-day moving-average region between $96.40 and $96.90, followed by the 100-day area near $92.90–$93.75.
A sustained move above $102 would extend the bullish structure. A break below $99.90 would indicate that momentum is weakening and could expose the $96.40–$96.90 region.
Brent Daily Chart
| Level 1 | Level 2 | Level 3 | |
| Resistance | $101.16 – $101.30 | $102.56 – $102.70 | $104.20 – $104.45 |
| Support | $99.20 – $99.35 | $97.40 – $97.90 | $94.50 – $94.75 |
Nasdaq 100 Technical Analysis
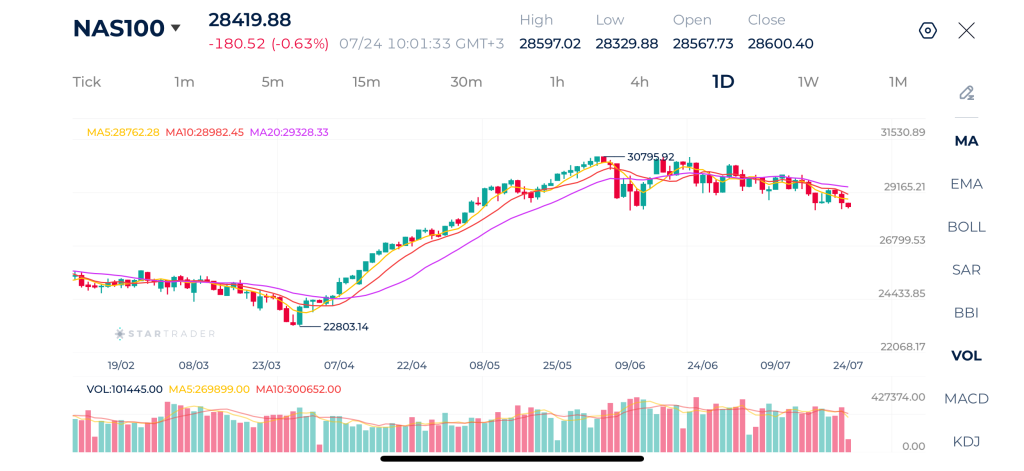
Nasdaq-100 futures have returned to a bearish daily structure after failing to hold the mid-week recovery above 29,300. Price is trading near 28,550, below the 5-day average at approximately 28,571, the 10-day average near 28,617, and the 20-day average around 28,714.
Immediate resistance is located at the 5-day average near 28,571, followed by the 10-day average at 28,617 and the stronger 20-day average near 28,714. Initial support is located around this week’s low between 28,435 and 28,465, followed by the previous daily low near 28,408.
A recovery above 28,714 would reduce immediate selling pressure, while a sustained break below 28,408 would confirm a deeper correction.
Nasdaq 100 Daily Chart
| Level 1 | Level 2 | Level 3 | |
| Resistance | 28,571 | 28,617 | 28,714 |
| Support | 28,435–28,465 | 28,408 | — |
EUR/USD Technical Analysis
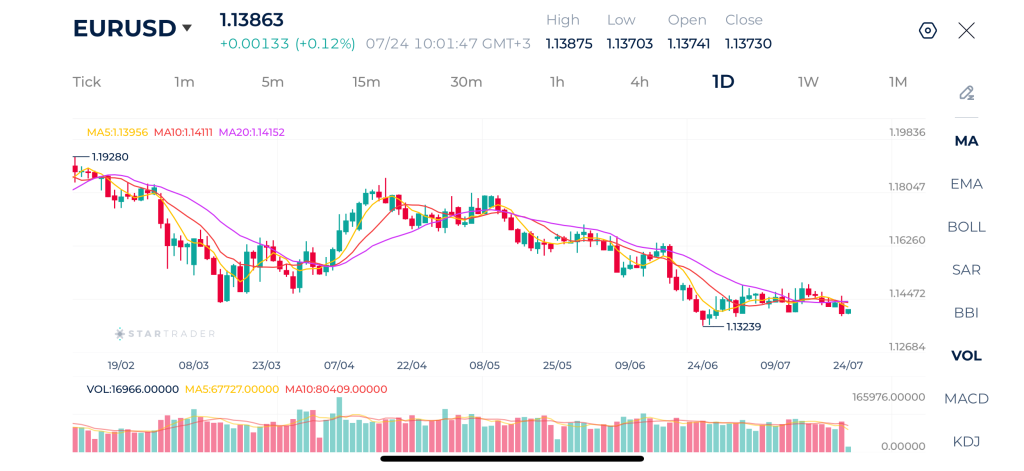
EUR/USD remains in a broader bearish daily structure, although the pair has recovered slightly from Thursday’s 1.1364 low. Price is trading near 1.1384, close to the 5-, 10-, and 20-day moving averages between approximately 1.1379 and 1.1382, but below the 50-, 100-, and 200-day averages.
Immediate resistance is located near 1.1440, followed by 1.1560 and 1.1620. initial support is located near 1.1375, followed by the weekly low at 1.1364 and the broader June low near 1.1325.
A break above 1.1460 would improve the daily outlook. A move below 1.1364 would restore downside pressure and expose 1.1300.
EUR/USD Daily Chart
| Level 1 | Level 2 | Level 3 | |
| Resistance | 1.1450 – 1.1458 | 1.1620 – 1.1627 | 1.1700 – 1.1712 |
| Support | 1.1323 – 1.1340 | 1.1251 – 1.1260 | 1.1200 – 1.1207 |
Risk Disclaimer: This material is provided for informational purposes only and does not constitute a recommendation or investment advice. Trading financial instruments on margin involves substantial risk and may not be appropriate for all investors.
Tags


Open Live Account
 Email Address
 Phone Number
Important Notice
STARTRADER does not accept any applications from Australian residents.
To comply with regulatory requirements, clicking the button will redirect you to the STARTRADER website operated by STARTRADER PRIME GLOBAL PTY LTD (ABN 65 156 005 668), an authorized Australian Financial Services Licence holder (AFSL no. 421210) regulated by the Australian Securities and Investments Commission.
Important Notice for Residents of the United Arab Emirates
In alignment with local regulatory requirements, individuals residing in the United Arab Emirates are requested to proceed via our dedicated regional platform at startrader.ae, which is operated by STARTRADER Global Financial Consultation & Financial Analysis L.L.C.. This entity is licensed by the UAE Capital Market Authority (CMA) under License No. 20200000241, and is authorised to introduce financial services and promote financial products in the UAE.
Please click the "Continue" button below to be redirected.


