








 Web Trader MT5









Key Takeaways
- Cooler-than-expected June CPI and a surprise PPI decline briefly lifted stocks and slashed July rate-hike odds from.
- Oil surged on the reinstated Hormuz blockade and an Iraqi export-terminal disruption, with Brent pushing toward the mid-$80s.
- Gold broke back below $4,000, as oil-driven inflation fears and dollar strength outweighed its safe-haven appeal.
- The DXY made a round trip rallying on blockade headlines Monday, sliding to a two-week low on soft inflation data, then recovering Thursday on resilient retail sales and jobless claims.
US Equities: A Choppy Week That Gave Back Its Gains
Wall Street started the week negatively. Monday’s session opened the week under pressure after President Trump announced the reinstatement of a naval blockade on Iranian shipping through the Strait of Hormuz, sending oil sharply higher and risk sentiment lower.
The tone improved mid-week once June’s inflation data landed softer than feared. Tuesday’s CPI print showed headline inflation running at 3.5% year-over-year, below the 3.8% consensus, easing pressure on the Fed and lifting the S&P 500 and the Nasdaq. Wednesday extended the relief rally as June producer prices unexpectedly fell 0.3% month-over-month with the annual rate slowing to 5.5% versus a 6.2% forecast.
That optimism didn’t survive the back half of the week. Thursday saw the market reverse hard as chip stocks sold off after Taiwan Semiconductor raised its 2026 capex guidance to $60–64 billion, spooking investors about margin pressure across the semiconductor complex, while renewed US strikes on Iranian targets kept geopolitical risk front and center.
Gold and Oil: Geopolitics Cuts Both Ways
Crude was this week’s standout mover. Brent crude surged from the mid $70s toward the mid-$80s as the reinstated blockade and fresh US airstrikes combined to squeeze supply expectations.
Gold, meanwhile, fell back below the psychologically important $4,000 level this week, sliding roughly 3% at one point to around $3,997 before hovering near $3,990. Rising oil prices raised inflation expectations, which reinforced the case for the Fed to stay restrictive and supported the dollar. Silver moved in tandem, dropping to around $57.50.
Forex: The Dollar’s Round Trip
The DXY dollar index opened the week firmer, near 101.14–101.30, as the blockade news drove haven flows into the greenback. That reversed sharply once the soft CPI and PPI prints landed Tuesday and Wednesday, dragging the index down to a two-week low around 100.40–100.92 as traders slashed the odds of a July Fed hike from roughly 43% to around 11–12%. The dollar then found its footing again on Thursday, climbing back to about 100.6 The index saw modest weekly decline during the week.
Forecast: Week of July 20–24
Next week will likely be dictated by two forces pulling in opposite directions: an accelerating Q2 earnings season and the unresolved US-Iran conflict.
Oil bias remains skewed higher near-term given the blockade and reduced Hormuz tanker traffic, with Brent likely to test the $85–$90 range on fresh escalation headlines.
Gold is likely to stay pressured below $4,000 as long as oil-driven inflation fears keep the Fed on hold, and as long as the dollar holds its ground.
Dollar index: Likely to stay range-bound between roughly 100 and 101.5, capped by soft inflation data and rate-cut expectations, but supported on dips by safe-haven flows and resilient growth data. A decisive break either way probably needs a fresh catalyst: a hawkish surprise from Fed officials, or a major de-escalation in the Middle East.
Major Economic Calendar Events for the Upcoming Week
| Monday, 20 July | Consumer Price Index | Canada | 1.0% | 4:30 PM |
| Monday, 20 July | Median CPI | Canada | 2.1% | 4:30 PM |
| Monday, 20 July | Trimmed CPI | Canada | 2.0% | 4:30 PM |
| Tuesday, 21 July | Consumer Price Index | New Zealand | 0.9% | 2:45 AM |
| Tuesday, 21 July | Claimant Count Change | UK | 31.2K | 10:00 AM |
| Wednesday, 22 July | Consumer Price Index | UK | 2.8% | 10:00 AM |
| Thursday, 23 July | Employment Change | Australia | 40.3K | 5:30 AM |
| Thursday, 23 July | Unemployment Rate | Australia | 4.4% | 5:30 AM |
| Thursday, 23 July | Interest Rate Decision | Euro | 2.40% | 4:15 PM |
| Thursday, 23 July | Monetary Policy Statement | Euro | 4:15 PM | |
| Thursday, 23 July | Unemployment Claims | USA | 4:30 PM | |
| Thursday, 23 July | ECB Press Conference | Euro | 4:45 PM | |
| Friday, 24 July | S&P Global Manufacturing PMI | USA | 53.9 | 5:45 PM |
| Friday, 24 July | S&P Global Services PMI | USA | 51.2 | 5:45 PM |
| Friday, 24 July | New Home Sales | USA | 580K | 6:00 PM |
Technical Analysis and Forecast:
Gold Technical Analysis
Gold remains in a well-defined downtrend, with price continuing to trade below the 5, 10, and 20-day moving averages. The recent recovery attempts have been limited, suggesting that sellers continue to dominate the broader trend.
Immediate support is located around $3,942, followed by the psychological $3,900 level. Resistance is seen at $4,070, with stronger resistance around $4,240. A break below $3,942 would reinforce the bearish trend, while a move above $4,070 would be required to signal a stronger recovery.
Gold Daily Chart
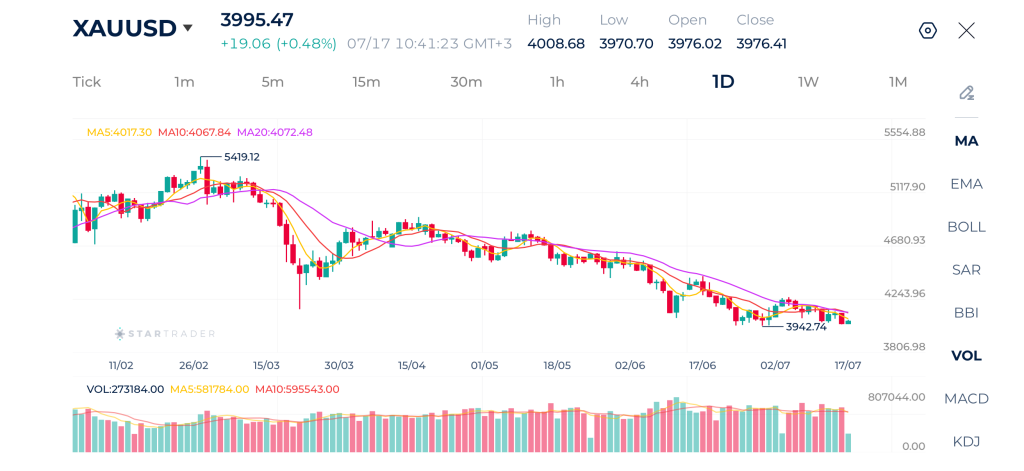
| Resistance | 4,070 | $4,135 | $4,200 |
| Support | $3,942 | $3,900 | $3,865 |
Brent Technical Analysis
Brent crude remains in an overall recovery trend after rebounding strongly from the $73.00–$75.00 region. Although prices have paused near $85.00, the moving averages continue to slope higher, suggesting that buyers remain in control despite the recent consolidation.
Immediate resistance is located at $85.40, followed by $92.80. Initial support is found around $80.10, with stronger support near $76.90. A break above $85.40 could extend the recovery, while a move below $80.10 would signal a loss of bullish momentum.
Brent Daily Chart
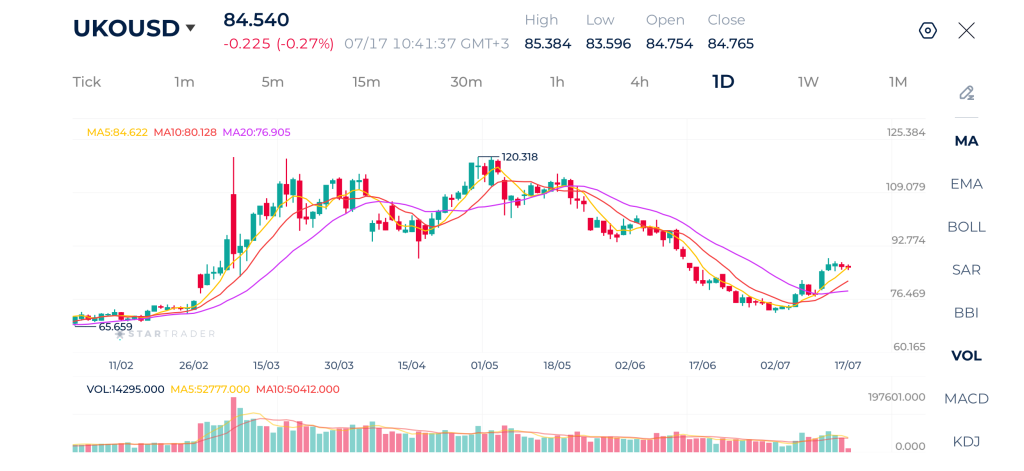
| Resistance | $86.40 | $88.25 | $90.00 |
| Support | $82.10 | $80.00 | $78.57 |
Nasdaq 100 Technical Analysis
The Nasdaq-100 has broken below the key 29,200 support area after failing to hold above the 20-day moving average. The recent decline has pushed price below the 5, 10, and 20-day moving averages, indicating weakening bullish momentum and increasing downside pressure.
Immediate support is located around 28,500, followed by 27,800. Resistance is now seen at 29,200, with stronger resistance near 30,000. A sustained break below 28,500 would confirm a deeper correction, while a recovery above 29,200 would ease the bearish outlook.
Nasdaq 100 Daily Chart
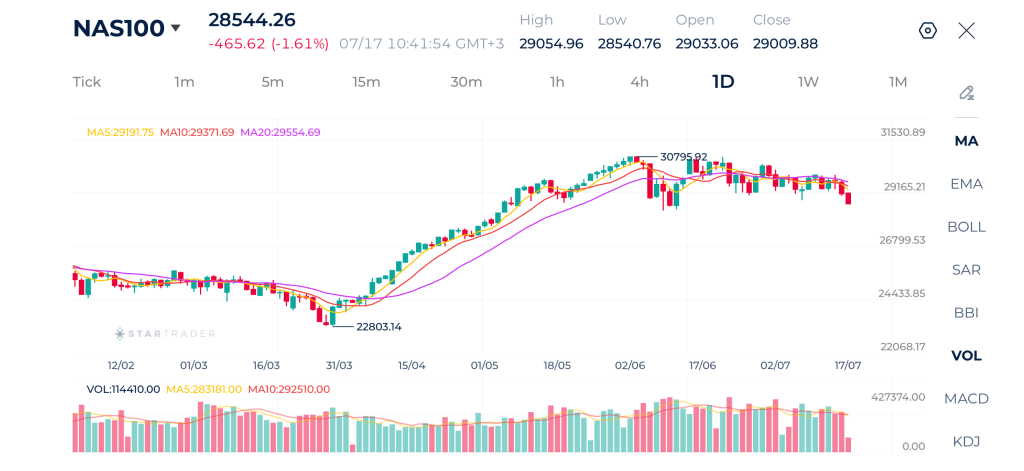
| Resistance | 29,200 | 30,000 | 30,468 |
| Support | 28,500 | 27,800 | 27,356 |
EURUSD Technical Analysis
EUR/USD remains under pressure despite rebounding from the 1.1324 support area. The pair has recovered toward 1.1450, with price trading slightly above the short-term moving averages. However, the 20-day MA continues to trend lower, indicating that the broader trend remains bearish.
Immediate resistance is located at 1.1500, followed by 1.1625. Initial support is found at 1.1400, with stronger support at 1.1324. A break above 1.1500 would improve the short-term outlook, while a move below 1.1400 could expose the recent lows.
EURUSD Daily Chart
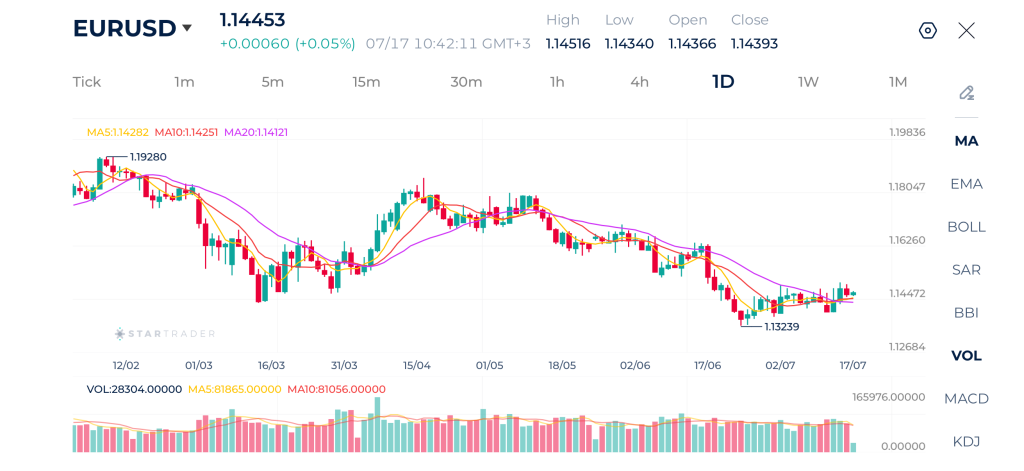
| Resistance | 1.1500 | 1.1624 | 1.1700 |
| Support | 1.1400 | 1.1325 | 1.1267 |
Risk Disclaimer: This material is provided for informational purposes only and does not constitute a recommendation or investment advice. Trading financial instruments on margin involves substantial risk and may not be appropriate for all investors.
Tags


Open Live Account
 Email Address
 Phone Number
Important Notice
STARTRADER does not accept any applications from Australian residents.
To comply with regulatory requirements, clicking the button will redirect you to the STARTRADER website operated by STARTRADER PRIME GLOBAL PTY LTD (ABN 65 156 005 668), an authorized Australian Financial Services Licence holder (AFSL no. 421210) regulated by the Australian Securities and Investments Commission.
Important Notice for Residents of the United Arab Emirates
In alignment with local regulatory requirements, individuals residing in the United Arab Emirates are requested to proceed via our dedicated regional platform at startrader.ae, which is operated by STARTRADER Global Financial Consultation & Financial Analysis L.L.C.. This entity is licensed by the UAE Capital Market Authority (CMA) under License No. 20200000241, and is authorised to introduce financial services and promote financial products in the UAE.
Please click the "Continue" button below to be redirected.


