








 Web Trader MT5









Key Takeaways
- Oil prices remained elevated around the $100 level, reflecting ongoing supply risks linked to the Iran conflict.
- Markets reacted sharply to comments from Donald Trump suggesting active negotiations with Iran, triggering temporary risk-on sentiment.
- Global markets remained highly volatile, driven almost entirely by geopolitical headlines more than economic data.
- Gold and silver traded in a choppy range, failing to rally strongly despite geopolitical tensions.
- The U.S. dollar strengthened, with the DXY approaching the key 100 level, acting as the primary safe haven.
- Investor sentiment shifted multiple times during the week, highlighting fragile market positioning.
Global Stocks Struggle to Find Direction
Stock markets experienced a headline-driven week, with sentiment shifting rapidly based on geopolitical developments.
At the beginning of the week, global equities traded cautiously as oil prices remained elevated and uncertainty around the conflict persisted. However, markets rallied mid-week after Donald Trump stated that negotiations with Iran were progressing, suggesting a potential de-escalation scenario. This triggered a short term risk-on move, with U.S. and global indices rebounding.
That optimism proved short lived. Iran quickly denied that any negotiations were taking place, causing markets to reassess the situation and pull back from highs.
Overall, U.S. indices ended the week mixed, with volatility dominating and no clear directional trend. European and Asian markets followed a similar pattern, reflecting global uncertainty and sensitivity to geopolitical headlines.
Oil Prices Stay Elevated
Oil remained the central driver of global markets throughout the week.
Prices traded around the $100 level for most of the week, with West Texas Intermediate fluctuating roughly between $93–$100 and Brent trading near $105–$108
The key driver was the ongoing Iran conflict and concerns around supply disruptions, particularly involving the Strait of Hormuz, which handles a significant portion of global oil flows.
At the start of the week, oil remained supported by geopolitical risk. However, prices dropped sharply mid-week after Trump suggested negotiations with Iran were underway, reducing immediate fears of supply disruption.
This move was quickly reversed after Iran denied any talks, pushing oil prices back higher and reinforcing the idea that the geopolitical risk premium remains firmly in place. By the end of the week, oil stabilized near $100.
Gold and Silver Fail to Rally
Despite the geopolitical environment, gold and silver failed to trend strongly, moving mostly sideways.
Gold fluctuated within a relatively tight range around $4,400–$4,600, while silver showed similar choppy behavior. Normally, such geopolitical tensions would push precious metals higher, but this time the reaction was muted.
The key reason was the strength of the U.S. dollar, which absorbed most of the safehaven demand. Investors preferred holding USD rather than non-yielding assets like gold.
As long as the dollar remains strong and inflation expectations stay elevated due to oil prices, precious metals are likely to remain range bound.
Looking ahead, markets will remain extremely sensitive to geopolitical headlines, particularly any updates regarding the Iran conflict.
Major Economic Calendar Events for the Upcoming Week
| Date | Metric | Country | Previous | Time [Dubai] |
| Monday, 30 March | German Retail Sales m/m | Euro | 10:00 AM | |
| Tuesday, 31 March | Tokyo Core CPI y/y | Japan | 1.80% | 3:30 AM |
| Tuesday, 31 March | Gross Domestic Product m/m | Canada | 0.20% | 4:30 PM |
| Tuesday, 31 March | JOLTS Job Openings | USA | 6.95m | 6:00 PM |
| Wednesday, 1 April | ADP Non-Farm Employment Change | USA | 63K | 4:15 PM |
| Wednesday, 1 April | Retail Sales m/m | USA | 0.20% | 4:30 PM |
| Wednesday, 1 April | ISM Manufacturing PMI | USA | 52.4 | 6:00 PM |
| Thursday, 2 April | Consumer Price Index m/m | Switzerland | 0.60% | 10:30 AM |
| Friday, 3 April | Non-Farm Employment Change | USA | -92K | 4:30 PM |
| Friday, 3 April | Unemployment Rate | USA | 4.40% | 4:30 PM |
| Friday, 3 April | ISM Services PMI | USA | 56.1 | 6:00 PM |
Technical Analysis and Forecast:
EURUSD Technical Analysis
EURUSD is trading around 1.1530 on the daily timeframe and continues to show a broader bearish structure despite recent attempts at stabilization.
Although there was a bounce from the 1.1400 support area recently, the recovery remains weak and corrective in nature. Price is currently hovering around the moving averages, which are beginning to flatten.
The inability to break above the 1.1600 resistance zone suggests that bearish momentum is still dominant. As long as the pair remains below this level, downside risks persist, with a potential move back toward 1.1400 and possibly lower if selling pressure accelerates.
EURUSD Daily Chart
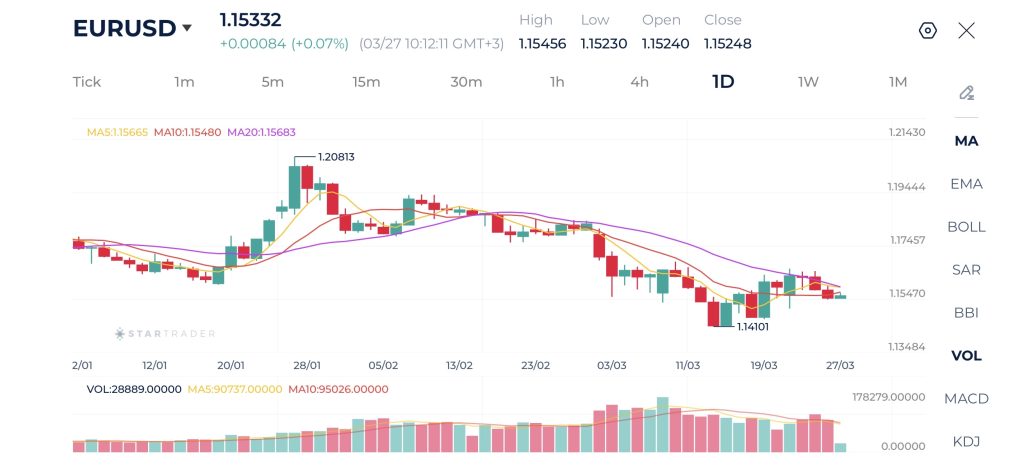
| Resistance | 1.1620 – 1.1636 | 1.1747 – 1.1760 | 1.1850 – 1.1860 |
| Support | 1.1410 – 1.1423 | 1.1325 – 1.1340 | 1.1220 – 1.1230 |
Gold Technical Analysis
Gold is trading around $4,450 and the recent price action shows a transition into a short term bullish correction, supported by higher lows and a gradual upward slope in the moving averages.
However, the broader structure still leans bearish, as the market remains below key resistance levels. Price is currently approaching the $4,500–$4,550 resistance zone, where momentum appears to be slowing. The alignment of moving averages suggests improving short term sentiment, but not enough to confirm a full trend reversal.
A breakout above this resistance could extend the recovery toward higher levels, while rejection may lead to another pullback toward the $4,300–$4,200 support area.
Gold Daily Chart
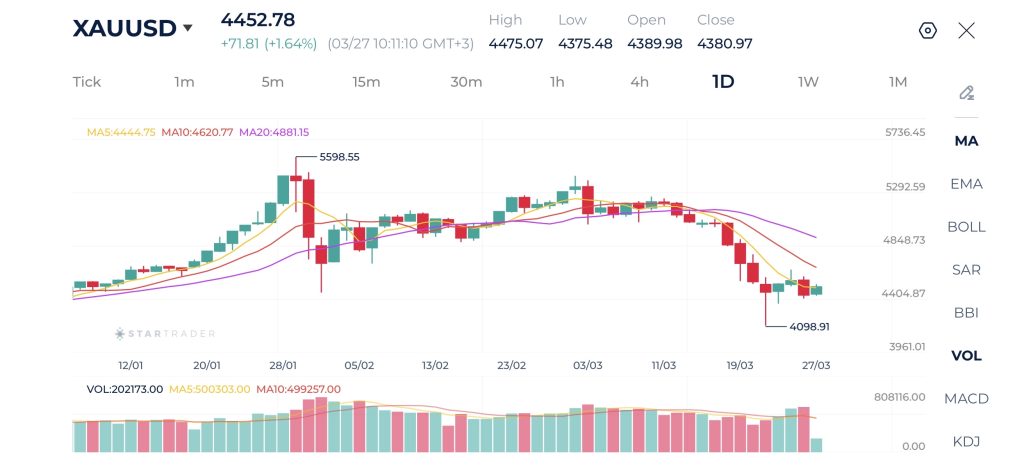
| Resistance | $4,500 – $4,525 | $4,820 – $4,848 | $4,935 – $4,950 |
| Support | $4,210 – $4,220 | $4,090 – $4,100 | $4,000 – $4,020 |
Gold Technical Analysis
Gold is trading around $4,450 and the recent price action shows a transition into a short term bullish correction, supported by higher lows and a gradual upward slope in the moving averages.
However, the broader structure still leans bearish, as the market remains below key resistance levels. Price is currently approaching the $4,500–$4,550 resistance zone, where momentum appears to be slowing. The alignment of moving averages suggests improving short term sentiment, but not enough to confirm a full trend reversal.
A breakout above this resistance could extend the recovery toward higher levels, while rejection may lead to another pullback toward the $4,300–$4,200 support area.
Gold Daily Chart
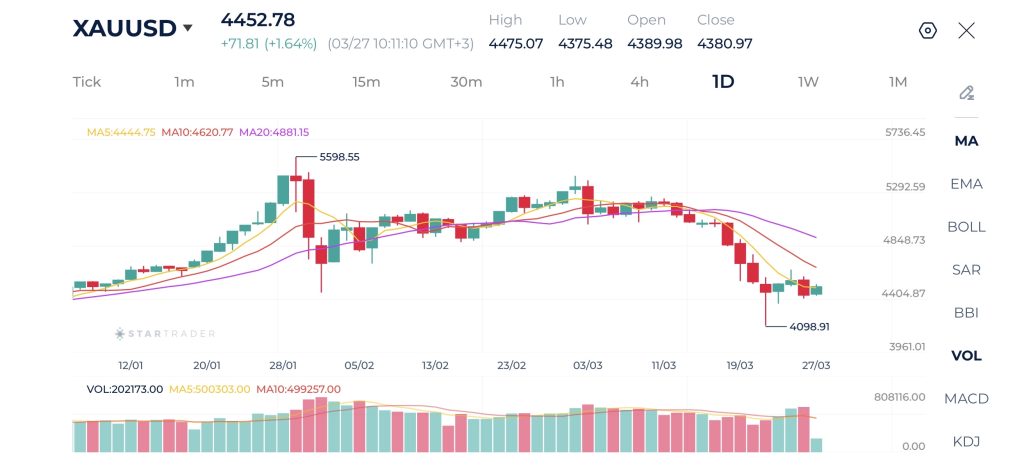
| Resistance | $4,500 – $4,525 | $4,820 – $4,848 | $4,935 – $4,950 |
| Support | $4,210 – $4,220 | $4,090 – $4,100 | $4,000 – $4,020 |
Brent Technical Analysis
Oil is trading around $106.00 and continues to show strong bullish momentum on the daily timeframe following a sustained upward move from earlier lows.
The market has been forming higher highs and higher lows, supported by a clear upward alignment of moving averages, indicating a well-established uptrend. The recent rally toward the $119.70 high highlights strong buying pressure, although price has since entered a consolidation phase near current levels. Despite this pause, the overall structure remains bullish, with price holding above key moving averages that act as dynamic support. As long as the market remains above the $102–$103 support zone, the bullish trend is likely to continue, with potential for another move toward previous highs. However, a break below this support could signal a deeper correction.
Brent Daily Chart
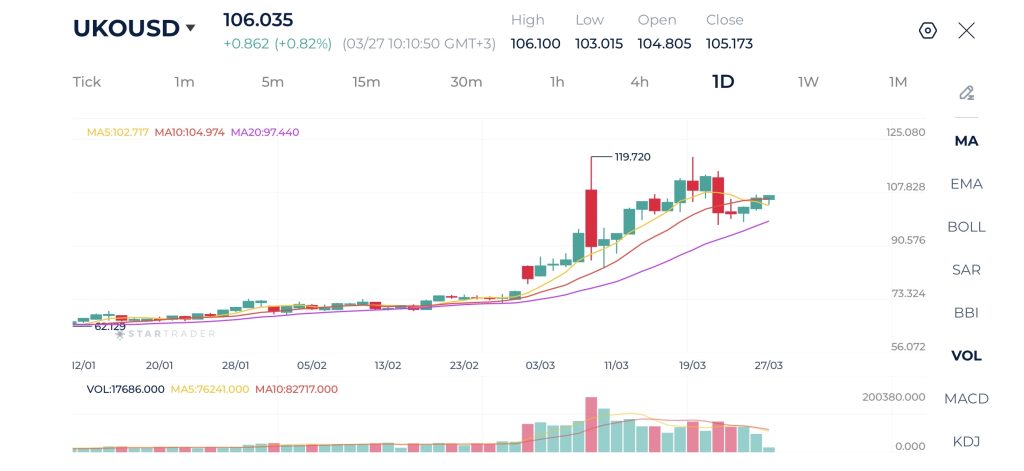
| Resistance | $113.10 – $113.42 | $115.16 – $115.32 | $117.20 – $117.40 |
| Support | $102.45 – $102.78 | $101.20 – $101.35 | $97.60 – $97.85 |
Dow Jones Technical Analysis
Dow Jones is trading near 46,166 and remains under pressure on the daily timeframe. While there are signs of short-term stabilization after bouncing from the 45,200 area, the recovery appears corrective. Price is still trading below the 20-day moving average, which continues to act as dynamic resistance, and shorter-term averages are struggling to maintain upward momentum. This suggests that sellers remain in control overall.
A failure to break above the 47,000 resistance zone could lead to renewed downside pressure, with potential targets near 45,000 and below.
Dow Jones Daily Chart
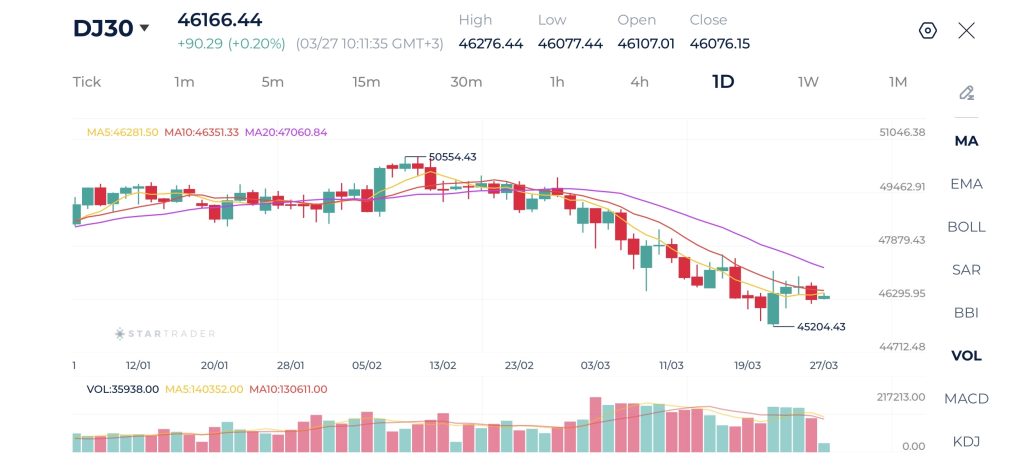
| Resistance | 46,800 – 46,842 | 47,450 – 47,510 | 48,250 – 48,300 |
| Support | 45,200 – 45,231 | 44,900 – 44,920 | 44,722 – 44,761 |
Risk Disclaimer: This material is provided for informational purposes only and does not constitute a recommendation or investment advice. Trading financial instruments on margin involves substantial risk and may not be appropriate for all investors.
Tags


Open Live Account
 Email Address
 Phone Number
Important Notice
STARTRADER does not accept any applications from Australian residents.
To comply with regulatory requirements, clicking the button will redirect you to the STARTRADER website operated by STARTRADER PRIME GLOBAL PTY LTD (ABN 65 156 005 668), an authorized Australian Financial Services Licence holder (AFSL no. 421210) regulated by the Australian Securities and Investments Commission.
Important Notice for Residents of the United Arab Emirates
In alignment with local regulatory requirements, individuals residing in the United Arab Emirates are requested to proceed via our dedicated regional platform at startrader.ae, which is operated by STARTRADER Global Financial Consultation & Financial Analysis L.L.C.. This entity is licensed by the UAE Capital Market Authority (CMA) under License No. 20200000241, and is authorised to introduce financial services and promote financial products in the UAE.
Please click the "Continue" button below to be redirected.


