








 Web Trader MT5









Key Takeaways
- Geopolitical tensions escalated sharply after the the U.S. attacked Iran, triggering strong reactions across commodities and safe-haven assets.
- Oil prices surged to their highest level since July 2024 amid disruption of the Strait of Hormuz, raising concerns about global energy supply.
- Precious metals rallied, but later reversed gains as the US dollar showed renewed strength.
- U.S. equities showed resilience, although volatility increased as investors assessed developments of the Middle East crisis.
- South Korea’s Kospi index plummeted more than 15% at the beginning of the week, but later regained some of these losses, reflecting risk-off sentiment across Asian markets.
- Cryptocurrencies rebounded strongly, led by Bitcoin, after supportive remarks from U.S. President Donald Trump.
US Indices Show Mixed Performance, South Korea’s Kopsi Drops Sharply
U.S. equity markets experienced a volatile trading week as geopolitical risks escalated. Despite the uncertainty, major indices managed to stabilize by the end of the week. Defensive sectors such as energy and defense stocks outperformed as investors positioned for prolonged geopolitical tension.
The Dow Jones Industrial Average and the S&P 500 traded within wide ranges, with the S&P 500 registering better performance and stabilizing around 6,850 levels. Nasdaq 100 reversed from the initial drop to 24,500 on Monday and recaptured 25,000 level. Dow Jones fell to its lowest level so far this year at 47,580. Energy companies benefited from rising oil prices, while technology stocks faced occasional profit taking as investors rotated into more defensive sectors.
Meanwhile, South Korean equities experienced a sharp sell-off at the beginning of the week. The benchmark KOSPI index dropped by more than 15% significantly during Monday and Tuesday trading as global investors reduced exposure to Asian risk assets amid heightened geopolitical uncertainty. Concerns about global trade disruptions and supply chain risks added pressure on export-oriented Korean companies. Some of the losses were later recovered as global markets stabilized.
The U.S. ADP employment report released during the week showed that the private sector added around 63,000 jobs in February, exceeding market expectations of roughly 48,000 and marking a rebound from the previous month’s weak reading. Despite the improvement, the overall pace of job creation remains relatively modest compared with previous years, reinforcing the view that the U.S. labor market is gradually cooling.
Safe Haven Demand Returns, But Dollar Strength Weighs on Metals
Gold and silver experienced strong gains during the week as geopolitical tensions intensified. Gold prices climbed above the $5,400 level on Monday, supported by a combination of geopolitical risk, increased volatility in equity markets, and ongoing uncertainty in the global economy. Silver also benefited from the surge in safe-haven demand, rising above $96 on Monday as well. However, these rallies were interrupted by the strength of the US dollar as the Dollar index (DXY) added more than 2% during the week.
Oil Surges on Disruptions to the Strait of Hormuz
Oil prices surged after reports that the Strait of Hormuz, a key global oil shipping route, faced disruption.
The Strait of Hormuz is responsible for transporting roughly 20% of global oil supply, making any threat to the shipping lane a major concern for energy markets. Markets quickly priced in a geopolitical risk premium, pushing crude oil prices sharply higher. Brent jumped more than 15% to $84.87, and WTI surged past $80 for the first time since August 2024.
Looking ahead, oil prices are expected to remain volatile and high as markets monitor developments in the Middle East.
Cryptocurrencies Recover with Bitcoin breaking Above $74,000
The cryptocurrency market staged a strong recovery during the week, with Bitcoin leading the rally across digital assets. The move came after supportive remarks from Donald Trump, who voiced strong backing for the cryptocurrency industry and criticized traditional banks over stablecoin yields opposition.
Bitcoin surged above the $74,000 level, recovering from the recent market downturn that had pushed the cryptocurrency below the $60,000 level in previous weeks. Ethereum and other major cryptocurrencies followed Bitcoin higher, with Ethereum ending the week above $2,000. The renewed bullish momentum reflected improving investor sentiment toward the crypto industry.
Key Economic Data of the week
- ISM Manufacturing PMI in the US surprises to the upside with a reading of 52.4 versus expectations of 51.7.
- CPI Flash Estimate y/y shows a higher reading of 1.9% versus 1.7% in the previous month.
- The Australian economy grows by 0.8% on a quarterly basis.
- ADP Non-Farm Employment Change shows an increase of 63K jobs in, higher than market expectations of 50K jobs.
- ISM Services PMI in the US jumped to 56.1 from 53.8 in the previous month.
- US weekly unemployment claims remain stable at 213K, slightly lower than consensus.
Major Economic Calendar Events for the Upcoming Week
| Date | Metric | Country | Previous | Time [Dubai] |
| Monday, 9 March | Eurogroup Meetings | Euro | All day | |
| Tuesday, 10 March | Final GDP q/q | Japan | 0.10% | 3:50 AM |
| Wednesday, 11 March | Consumer Price Index y/y | USA | 2.40% | 4:30 PM |
| Thursday, 12 March | Unemployment Claims | USA | 4:30 PM | |
| Friday, 13 March | Gross Domestic Product m/m | UK | 0.10% | 11:00 AM |
| Friday, 13 March | Unemployment Rate | Canada | 6.50% | 4:30 PM |
| Friday, 13 March | Core PCE Price Index m/m | USA | 0.40% | 4:30 PM |
| Friday, 13 March | Preliminary GDP q/q | USA | 1.40% | 4:30 PM |
| Friday, 13 March | JOLTS Job Openings | USA | 6.54m | 6:00 PM |
Technical Analysis and Forecast:
Gold Technical Analysis
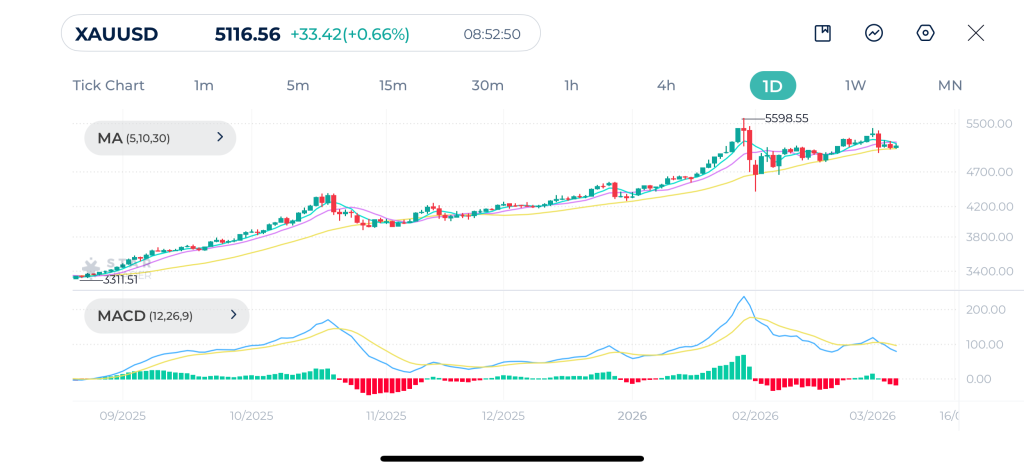
On the daily timeframe, Gold continues to maintain a strong long term bullish structure despite the recent consolidation phase.
The moving averages support the bullish structure. Price remains positioned above the 30-day moving average, which is trending upward and acting as dynamic support. Meanwhile, shorter term averages MA(5) and MA(10) have flattened and are moving close to the price. As long as the price holds above the longer-term moving average, the broader bullish trend remains valid.
MACD has declined from previously elevated levels and is approaching the zero line, indicating that bullish momentum has weakened in the short term. This suggests that the market may continue to consolidate or correct slightly before the next directional move.
Technically, support levels are seen around $5,000 and $4,800, while resistance remains near $5,500–$5,600, the previous high. A break above this resistance would signal a continuation of the broader uptrend and could open the door for further gains. On the other hand, a sustained break below $5,000 could trigger a deeper correction toward the next support levels.
Gold Daily Chart
| Resistance | $5,246 – $5,260 | $5,418 – $5,438 | $5,500 – $5,526 |
| Support | $5,000 – $5,023 | $4,840 – $4,877 | $4,655 – $4,673 |
S&P 500 Technical Analysis
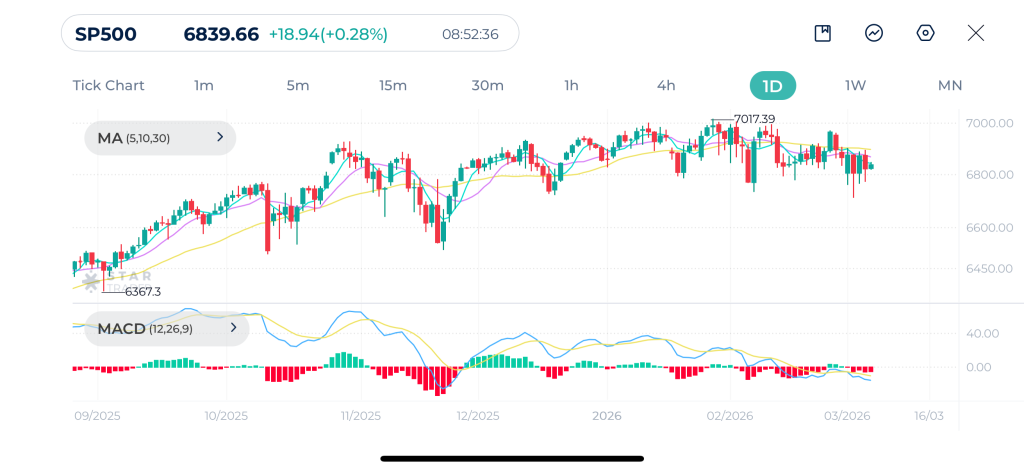
The S&P 500 on the daily timeframe shows signs of entering a consolidation phase after an extended bullish trend. Recent price action indicates that upward momentum has slowed, with the market now trading within a sideways range between approximately 6,800 and 7,000.
Current alignment of moving averages reflects a loss of directional momentum and the emergence of a range-bound market.
MACD has been gradually declining and is approaching the zero line. This suggests that buying pressure has slowed significantly, though it has not yet turned decisively bearish.
From a technical standpoint, 6,800 acts as immediate support, while stronger support lies near 6,700 and 6,500. On the upside, 7,000 remains the key resistance level, as it marks the recent peak of the index. A clear breakout above this level could signal the resumption of the broader uptrend, whereas a break below the support area could open the door for a deeper correction.
S&P 500 Daily Chart
| Resistance | 6,904 – 6,925 | 6,970 – 6,986 | 7,014 – 7,030 |
| Support | 6,759 – 6,771 | 6,711 – 6,730 | 6,675 – 6,692 |
Bitcoin Technical Analysis
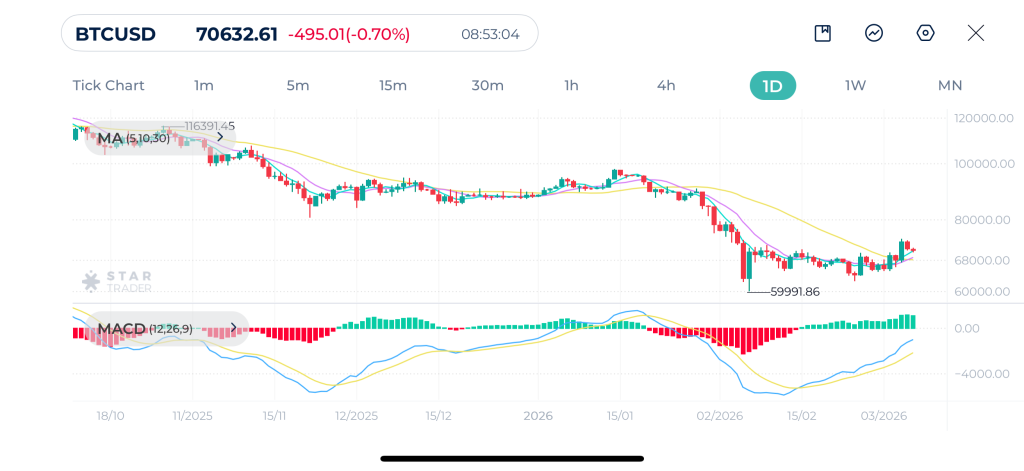
On the daily timeframe, Bitcoin appears to be attempting a recovery after a strong corrective move that pushed prices down toward the $60,000 region, which acted as a key support level. The market has since rebounded toward the $70,000–$72,000 area, where the price is currently consolidating.
Looking at the moving averages, price has managed to climb back above the short-term moving averages MA(5) and MA(10) which suggests improving short term momentum. However, the 30-day moving average remains above the price. For the bullish outlook to strengthen, Bitcoin would need to sustain a move above the 30-day moving average and break above the $72,000–$75,000 resistance zone, which previously acted as a consolidation region before the last decline.
MACD has recently crossed higher and is moving toward the zero line. The indicator remains below the neutral level, which means the recovery phase is still developing and confirmation is needed before declaring a full trend shift.
From a technical perspective, the $68,000–$70,000 zone now acts as immediate support, while stronger support remains near $60,000. On the upside, resistance levels are seen around $72,000, followed by $80,000 if bullish momentum continues. A sustained break above the first resistance would strengthen the recovery scenario, while a rejection could lead to renewed consolidation within the current range.
Bitcoin Daily Chart
| Resistance | $75,837 – $76,000 | $80,573 – $81,107 | $85,588 – $86,120 |
| Support | $66,256 – $67,000 | $62,545 – $62,937 | $59,930 – $60,000 |
Brent Daily Chart
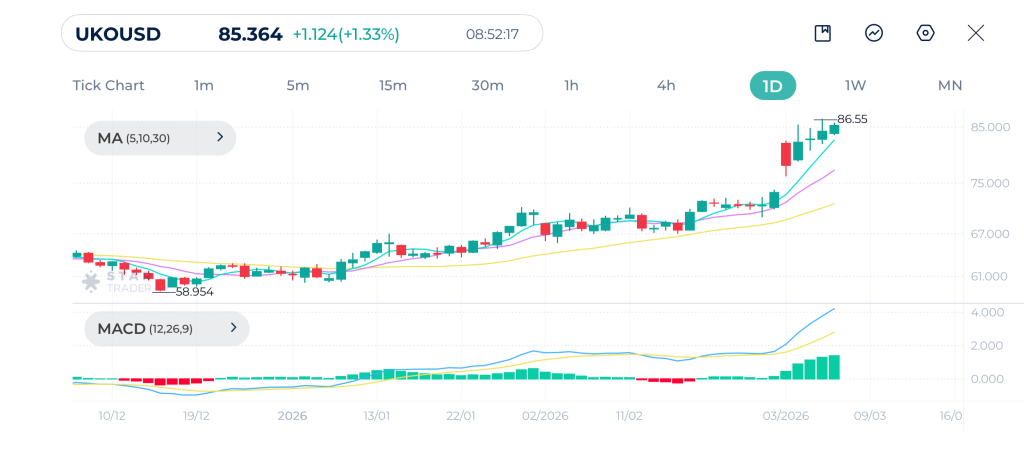
As seen on the daily chart, crude oil Brent is currently experiencing a strong bullish breakout. Price recently cleared a strong resistance zone near $75.00 and has moved sharpy beyond $80.
Moving averages MA(5), MA(10), and MA(30) are aligned for a bullish trend. The widening gap between these lines indicates that the momentum is accelerating.
MACD is providing a strong confirmation of the current rally. MACD line and signal line are both rising steeply and are well above the zero line.
It’s important to note that MACD is entering overbought territory, which may eventually lead to a cooling-off period or a retest of the breakout levels.
| Resistance | $84.80 – $84.96 | $85.60 – $85.77 | $86.25 – $86.40 |
| Support | $81.45 – $81.60 | $79.42 – $79.68 | $77.94 – $78.12 |
Tags


Open Live Account
 Email Address
 Phone Number
Important Notice
STARTRADER does not accept any applications from Australian residents.
To comply with regulatory requirements, clicking the button will redirect you to the STARTRADER website operated by STARTRADER PRIME GLOBAL PTY LTD (ABN 65 156 005 668), an authorized Australian Financial Services Licence holder (AFSL no. 421210) regulated by the Australian Securities and Investments Commission.
Important Notice for Residents of the United Arab Emirates
In alignment with local regulatory requirements, individuals residing in the United Arab Emirates are requested to proceed via our dedicated regional platform at startrader.ae, which is operated by STARTRADER Global Financial Consultation & Financial Analysis L.L.C.. This entity is licensed by the UAE Capital Market Authority (CMA) under License No. 20200000241, and is authorised to introduce financial services and promote financial products in the UAE.
Please click the "Continue" button below to be redirected.


