


Key Takeaways
- Global markets started the week under pressure as Donald Trump escalated tariff threats against Europe linked to Greenland, triggering a sharp risk-off move.
- U.S. equities suffered their worst single-day decline in months early in the week, with technology stocks leading losses.
- Precious metals surged aggressively, with gold and silver hitting fresh all-time highs amid geopolitical stress and policy uncertainty.
- Midweek sentiment shifted sharply after Trump withdrew tariff threats and confirmed a framework deal with NATO over Greenland.
Precious Metals Continue to Rally
Commodities were the standout performers of the week, led by precious metals. Gold surged to a series of new all-time highs, breaking decisively above the $4,900 level, while silver rallied aggressively and continued to outperform on a relative basis. The rally was fueled by a combination of factors, including heightened geopolitical uncertainty, concerns about U.S. policy credibility, renewed questions about Federal Reserve independence, and persistent expectations for rate cuts in 2026.
Even as trade tensions eased later in the week, gold held onto most of its gains, highlighting strong underlying demand from both safe haven flows and long term strategic buyers. Silver benefited from the same macro backdrop, with additional support from industrial demand expectations. Oil prices were more balanced, initially rising on geopolitical risk and supply disruptions, before stabilizing as U.S.–Europe tensions cooled. Looking ahead, precious metals remain supported as long as uncertainty around global politics, monetary policy, and fiscal discipline persists, although some short-term consolidation would be healthy after such a steep rally.
US Markets Recovered after a Short Decline
U.S. equity markets had a two-phase week. Major indices fell sharply at the start as tariff threats triggered a more selling, pushing yields higher and the dollar lower. Technology stocks led the decline, and the S&P 500 and Nasdaq briefly recorded their worst sessions in several months. Sentiment turned decisively midweek after Trump walked back his tariff plans and confirmed progress toward a Greenland deal framework. This sparked a broad-based relief rally, with financials, energy, and small-cap stocks leading the rebound. By the end of the week, U.S. indices had recovered a significant portion of their losses, reinforcing the market’s resilience.
Weaker Dollar Pushed Major Currencies Higher
In the foreign exchange market, the U.S. Dollar Index was highly volatile. The dollar weakened sharply early in the week by more than 1% amid trade war fears and concerns over Fed independence, before stabilizing and rebounding slightly as geopolitical risks eased. Despite the recovery, the broader dollar trend remains fragile, with markets still pricing in rate cuts later in 2026. EUR/USD surged on tariff headlines and risk aversion, nearing major resistance level of 1.1800. USD/JPY remained elevated, trading at around 160.00 level, supported by political uncertainty in Japan and yield differentials, while GBP and AUD traded in wide ranges, reacting to shifts in global risk sentiment rather than domestic fundamentals.
Key Economic Data of the week
- Canadian CPI inflation remains stable at 2.8% on a yearly basis.
- Claimant data in the UK showed an increase to 17.9K in the month of December.
- Yearly CPI inflation in the UK rose to 3.4%, higher than market expectations of 3.3%.
- The Australian unemployment rate drops from 4.3% to 4.1% in December.
- Updated GDP numbers for Q3 2025 showed the US economy grew by 4.4%
- Core PCE price index remains at 0.2% on a monthly basis, in line with expectations.
- Bank of Japan leaves benchmark interest rate unchanged at 0.75%.
Major Economic Calendar Events for the Upcoming Week
| Date | Metric | Country | Previous | Time [Dubai] |
| Monday, 26 January | German IFO Business Climate | Euro | 87.6 | 1:00 PM |
| Tuesday, 27 January | New Home Sales | USA | Tentative | |
| Wednesday, 28 January | Consumer Price Index y/y | Australia | 3.40% | 4:30 AM |
| Wednesday, 28 January | Interest Rate Decision | Canada | 2.25% | 6:45 PM |
| Wednesday, 28 January | Federal Funds Rate | USA | 3.75% | 11:00 PM |
| Thursday, 29 January | Unemployment Claims | USA | 5:30 PM | |
| Friday, 30 January | Tokyo Core CPI y/y | Japan | 2.30% | 3:30 AM |
| Friday, 30 January | Gross Domestic Product m/m | Canada | 0% | 5:30 PM |
| Friday, 30 January | Producer Price Index | USA | 0.20% | 5:30 PM |
Technical Analysis and Forecast:
Gold Technical Analysis
Gold continues to exhibit exceptional strength on the daily timeframe, extending its bullish trend and trading near the $4,950 area. The market structure remains bullish, with higher highs and higher lows forming since the breakout above the $4,000–$4,100 region.
The moving averages strongly validate this bullish trend. Price is well above the 5, 10, and 30-day moving averages. The 30-day moving average defines the broader trend base.
MACD is well above the zero line. As long as gold holds above the $4,750–$4,800 support zone, the overall trend remains bullish, with psychological levels above $5,000 increasingly coming into focus.
Gold Daily Chart
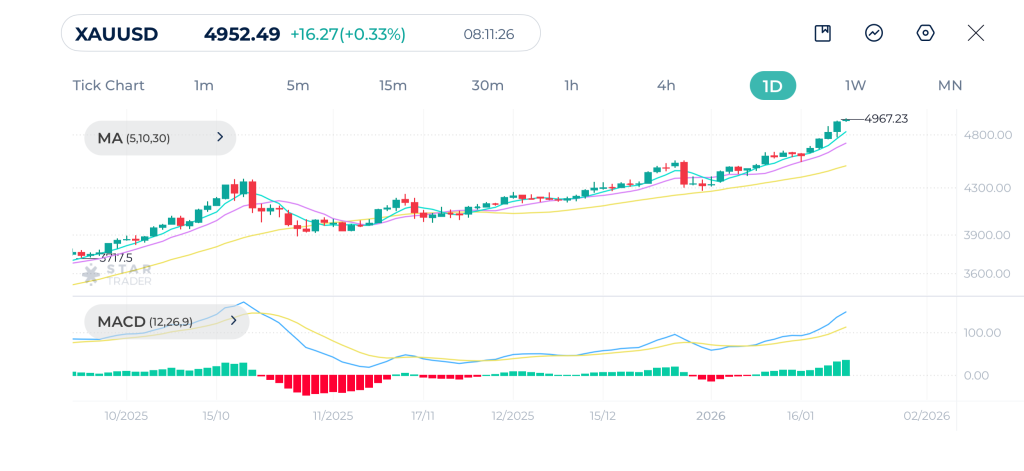
| Resistance | $4,996 – $5,000 | $5,050 – $5,065 | $5,100 – $5,120 |
| Support | $4,875 – $4,888 | $4,767 – $4,780 | $4,700 – $4,713 |
Bitcoin Technical Analysis
Bitcoin continues to trade within a broader corrective structure on the daily timeframe. The recent bounce toward the $95,000–$97,000 region has failed to gain traction, and price has once again rotated lower toward the $89,000–$90,000 zone.
Technically, price is trading below the 30-day moving average, which has turned downward and now acts as dynamic resistance.
MACD remains near or below the zero line and signaling renewed downside pressure. While downside momentum is not as aggressive as during the initial sell-off, there are still no strong signs of trend reversal. The $88,000–$85,000 zone remains key support, while the broader trend will remain vulnerable as long as Bitcoin fails to reclaim the daily moving average cluster.
Bitcoin Daily Chart
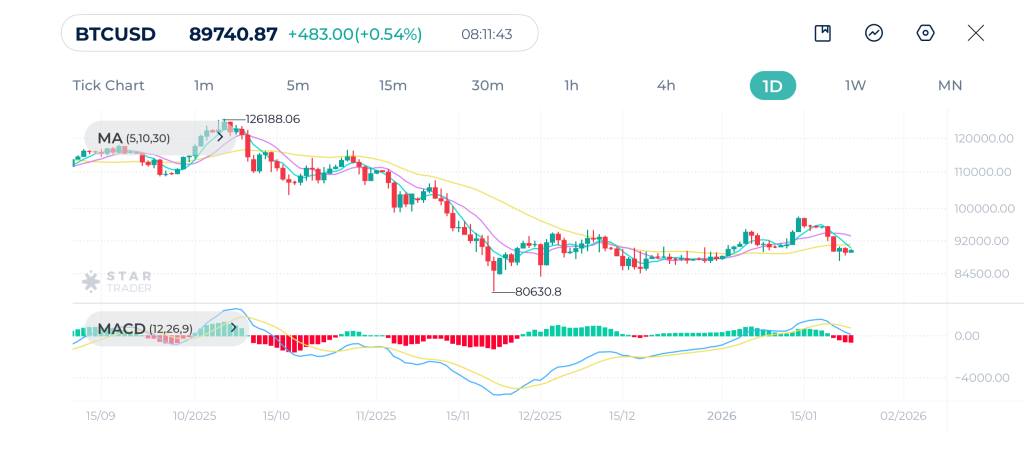
| Resistance | $91,176 – $91,200 | $92,614 – $92,700 | $93,741 – $93,800 |
| Support | $87,127 – $87,185 | $86,320 – $86,395 | $85,443 – $85,480 |
USDJPY Technical Analysis
USDJPY remains in a strong and well-established bullish trend on the daily timeframe, trading near the psychological 159.00 area. The broader market structure is clearly bullish, defined by a persistent sequence of higher highs and higher lows.
Price is trading above the three daily moving averages MA(5), MA(10), and MA(30), all of which are sloping upward. This alignment confirms strong trend health.
MACD remains above the zero line, with the MACD line holding above the signal line. Although momentum is not accelerating aggressively, it remains constructive. A sustained break above 159.50 would open the door for further upside extension, while any pullback toward the rising moving averages would likely be corrective in nature.
USDJPY Daily Chart USDJPY
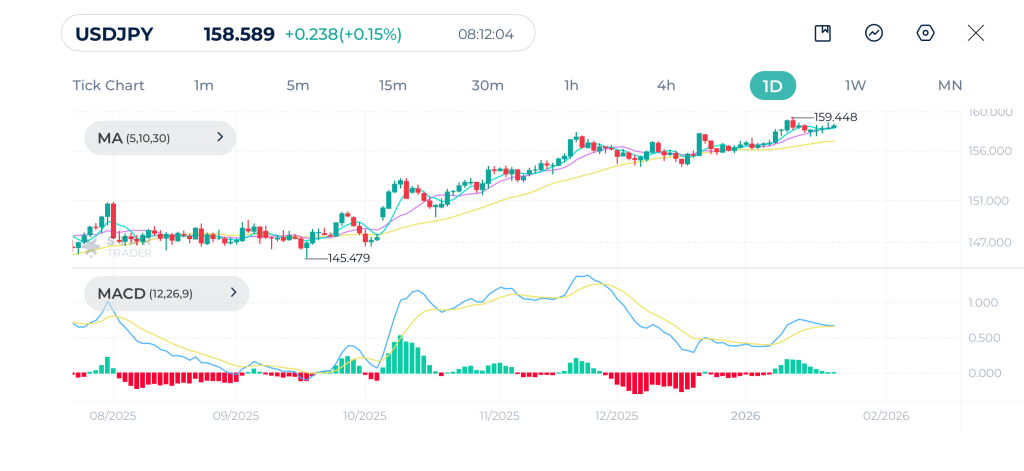
| Resistance | 159.34 – 159.40 | 160.00 – 160.10 | 161.00 – 161.05 |
| Support | 158.40 – 158.51 | 157.91 – 158.07 | 157.42 – 157.50 |
Tags
Open Live Account
Please enter a valid country
No results found
No results found
Please enter a valid email
Please enter a valid verification code
1. 8-16 characters + numbers (0-9) 2. blend of letters (A-Z, a-z) 3. special characters (e.g, !a#S%^&)
Please enter the correct format
Please tick the checkbox to proceed
Please tick the checkbox to proceed
Important Notice
STARTRADER does not accept any applications from Australian residents.
To comply with regulatory requirements, clicking the button will redirect you to the STARTRADER website operated by STARTRADER PRIME GLOBAL PTY LTD (ABN 65 156 005 668), an authorized Australian Financial Services Licence holder (AFSL no. 421210) regulated by the Australian Securities and Investments Commission.
CONTINUEImportant Notice for Residents of the United Arab Emirates
In alignment with local regulatory requirements, individuals residing in the United Arab Emirates are requested to proceed via our dedicated regional platform at startrader.ae, which is operated by STARTRADER Global Financial Consultation & Financial Analysis L.L.C.. This entity is licensed by the UAE Capital Market Authority (CMA) under License No. 20200000241, and is authorised to introduce financial services and promote financial products in the UAE.
Please click the "Continue" button below to be redirected.
CONTINUEError! Please try again.

