








 Web Trader MT5









Key Takeaways
- FOMC minutes revealed the Fed’s worry over sticky energy and core inflation, driving a broad retreat in equities as investors pushed rate cut timelines further out.
- Crude oil started the week higher before plunging when President Trump announced a pause on planned airstrikes to pursue negotiations.
- Nvidia delivered a strong Q1 earnings report, proving that the artificial intelligence infrastructure boom is operating with efficiency.
- Gold remained compressed but resilient within a historically elevated range, caught in a tug-of-war between rising Treasury yields and ongoing Middle East uncertainties.
US Market: Stocks Retreat as Yields Face Inflation Fears
U.S. equity markets experienced a volatile week as rising Treasury yields initially pressured investor sentiment before stocks rebounded strongly toward the end of the week. The S&P 500 opened the week around 7,393, declined to nearly 7,334 amid concerns over surging borrowing costs, but later recovered to close near 7,473.
The tech-heavy Nasdaq 100 followed a similar path, opening around 29,065 before falling to 28,569 as growth stocks came under pressure from rising yields, then rebounding sharply to finish near 29,497. Meanwhile, the Dow Jones Industrial Average showed relative resilience, opening at 49,360, dipping to 49,074, and eventually climbing to around 50,500.
The main driver behind the early-week weakness was the sharp rise in U.S. Treasury yields, with long-term yields reaching their highest levels since 2007. Higher yields tend to reduce the attractiveness of equities by increasing borrowing costs for companies and offering investors stronger returns from safer fixed-income assets. This particularly impacts high-growth technology stocks, as higher discount rates can weigh on future earnings valuations. However, improving sentiment later in the week and continued confidence in corporate earnings helped major indices recover their losses and end the week on a stronger note.
Gold Remains Range-Bound, Oil Moves Lower
Crude oil prices started the week strong as concerns ran high of further escalation in the Middle East. However, the narrative flipped on Tuesday morning. Prices dropped by over 2.5% after President Trump announced a temporary pause on an imminent military strike against Iran.
Gold prices traded in a relatively volatile but range bound manner throughout the week, opening around $4,538 and fluctuating between $4,440 and $4,588 as investors reacted to movements in the U.S. dollar and Treasury yields. The precious metal continued to show its typical inverse relationship with the DXY, as the dollar index started near 99.20 and traded within a range of 98.95 to 99.50.
Major Economic Calendar Events for the Upcoming Week
| Date | Metric | Country | Previous | Time [Dubai] |
| Monday, 25 May | Corporate Profits q/q | Canada | -1.60% | 4:30 PM |
| Tuesday, 26 May | CB Consumer Confidence | USA | 92.8 | 6:00 PM |
| Wednesday, 27 May | Consumer Price Index y/y | Australia | 4.60% | 5:30 AM |
| Wednesday, 27 May | Interest Rate Decision | New Zealand | 2.25% | 6:00 AM |
| Thursday, 28 May | Core PCE Price Index m/m | USA | 0.30% | 4:30 PM |
| Thursday, 28 May | Preliminary GDP q/q | USA | 0.70% | 4:30 PM |
| Thursday, 28 May | New Home Sales | USA | 682K | 6:00 PM |
| Friday, 29 May | Tokyo Core CPI y/y | Japan | 1.50% | 3:30 AM |
| Friday, 29 May | Gross Domestic Product m/m | Canada | 52.7 | 4:30 PM |
Technical Analysis and Forecast:
Gold Technical Analysis
Gold remains under strong bearish pressure on the daily timeframe following the major rejection from the $5,419 peak. The chart continues to show a broader downtrend structure, with price trading below the MA5, MA10, and MA20 moving averages.
Gold has recently entered another consolidation phase near the lower part of the range around $4,500–$4,550. However, this sideways movement appears weak, as buyers continue struggling to establish higher highs. The repeated failures near the $4,750 resistance region indicate that selling pressure remains active whenever price attempts to recover. The latest candles also show limited bullish momentum, with price hovering beneath the short-term averages and remaining vulnerable to another leg lower.
The $4,500 area is currently acting as immediate support. A decisive break below that zone could expose the market to renewed bearish acceleration toward $4,360 and potentially the previous swing low near $4,100. On the upside, bulls would first need to reclaim the $4,600–$4,760 resistance region and sustain daily closes above the MA20 to signal that the bearish trend is weakening. Until then, the broader technical structure continues to favor sellers.
Overall, gold remains technically weak on the daily timeframe, and unless the market produces a stronger reversal structure above key resistance levels, the dominant trend still points toward further downside pressure.
Gold Daily Chart
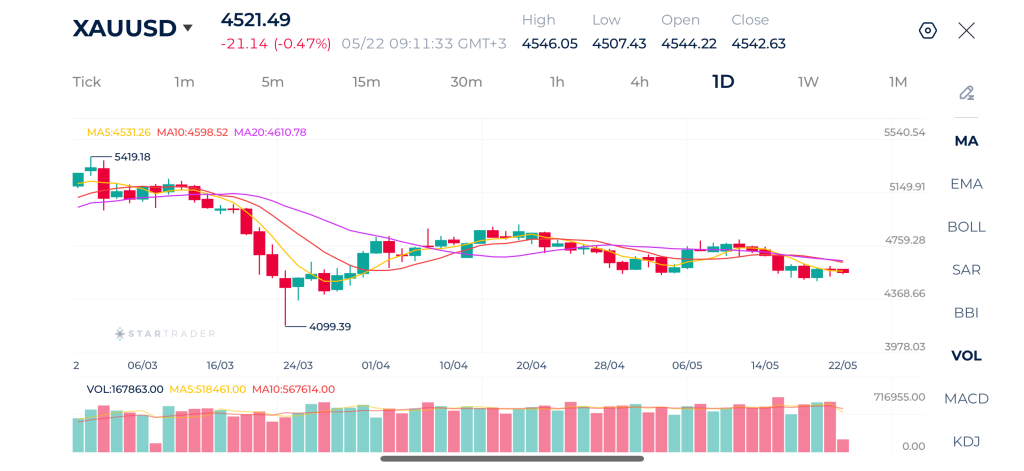
| Resistance | $4,637 – $4,650 | $4,772 – $4,790 | $4,888 – $4,900 |
| Support | $4,450 – $4,456 | $4,354 – $4,370 | $4,267 – $4,280 |
Brent Technical Analysis
The daily chart on Brent reveals a broad, highly volatile uptrend that has recently transitioned into a horizontal consolidation phase. The moving averages have begun to flatten out and converge, with the MA5, MA10, and MA20 clustering closely together, which is a classic technical signature of a market stripping away its directional trend in favor of range-bound trading. The trading volume has also progressively tapered off from the high spikes seen during the initial March rally, indicating a lack of strong conviction from market participants at these elevated prices. Traders should look for a clean break outside of this tightening consolidation boundary to signal the next major directional expansion.
Brent Daily Chart
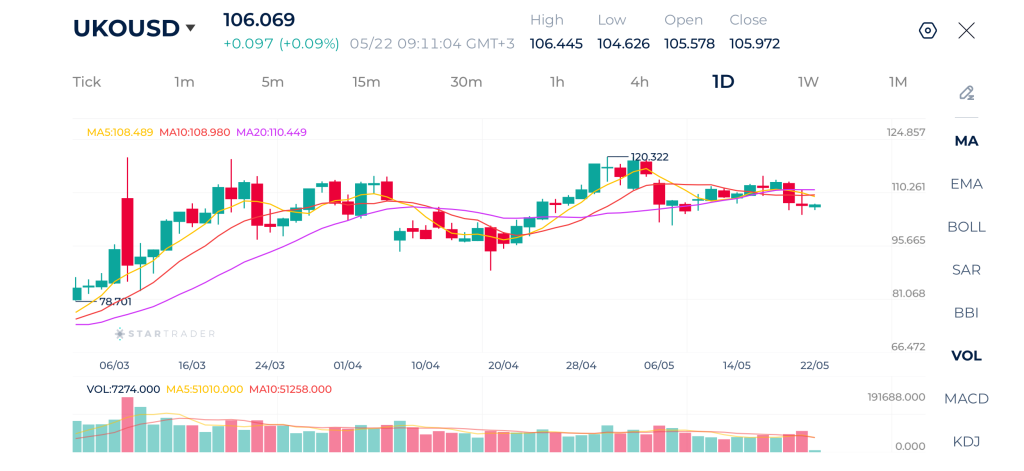
| Resistance | $106.29 – $106.67 | $109.59 – $109.80 | $111.35 – $111.60 |
| Support | $102.45 – $102.76 | $99.27 – $99.60 | $97.23 – $97.45 |
S&P 500 Technical Analysis
The SP500 index displays a powerful and sustained bullish trend that originated from a major swing low at 6318.09 in early April. Since breaking out of that bottoming formation, the index has sequentially maintained a structure of higher highs and higher lows, climbing to its current level of 7476.15. The technical strength of this asset is underscored by the textbook bullish alignment of its moving averages, where the shorter-term MA5 sits comfortably above the MA10, which in turn resides above the longer-term MA20. The candlesticks have consistently tracked the MA5 and MA10 lines as dynamic support during brief intraday pullbacks, including a minor correction around mid-May near 7525.10 that was swiftly bought up. The transaction volume has stabilized at a healthy baseline during this steady ascent, reinforcing the sustainability of the trend. This price action reflects strong institutional accumulation, and the bias remains heavily skewed to the upside until a decisive break below the ascending MA20 line occurs.
S&P 500 Daily Chart
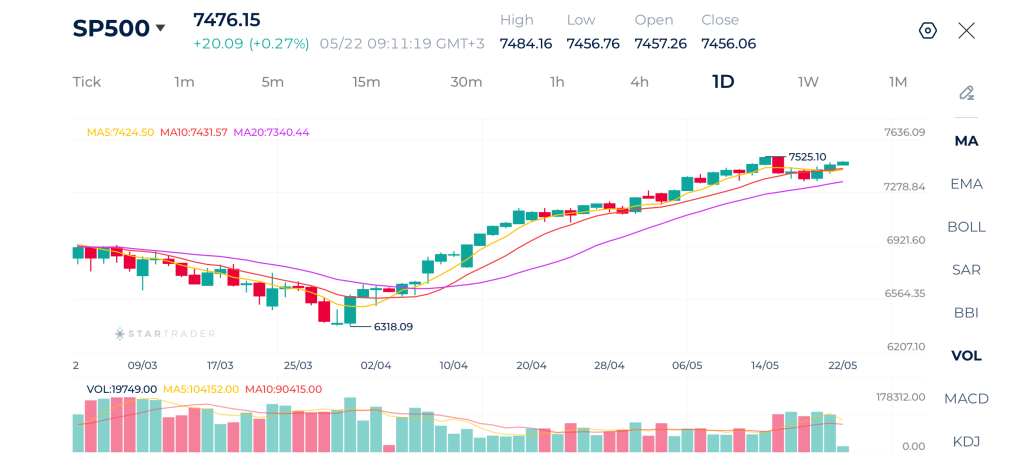
| Resistance | 7,500 – 7,515 | 7,560 – 7,550 | 7,600 – 7,610 |
| Support | 7,330 – 7,345 | 7,252 – 7,265 | 7,174 – 7,190 |
EURUSD Technical Analysis
EURUSD is showing signs of continued bearish pressure on the daily timeframe. Price has now fallen below both the MA5 and MA10 moving averages, while approaching the MA20 around 1.1690 from underneath. The moving averages are beginning to shift into a bearish structure. The rejection from the 1.1849 high formed a clear lower-high structure, suggesting that buyers are losing control of the broader uptrend that dominated earlier in April.
The recent candles reflect steady downside momentum, which usually indicates a controlled bearish correction. Price is currently stabilizing around the 1.1600–1.1630 support zone, an area that could determine the next directional move. If EURUSD breaks decisively below this region, sellers may target 1.1500 initially, followed by deeper downside toward the March support area near 1.1410. On the upside, buyers would need to reclaim the MA20 and break back above 1.1700–1.1760 to restore stronger bullish momentum. Until that happens, rebounds are likely to face selling pressure near the moving averages.
Overall, the chart currently favors a continuation of the corrective bearish trend unless buyers regain control above the recent resistance zones.
EURUSD Daily Chart
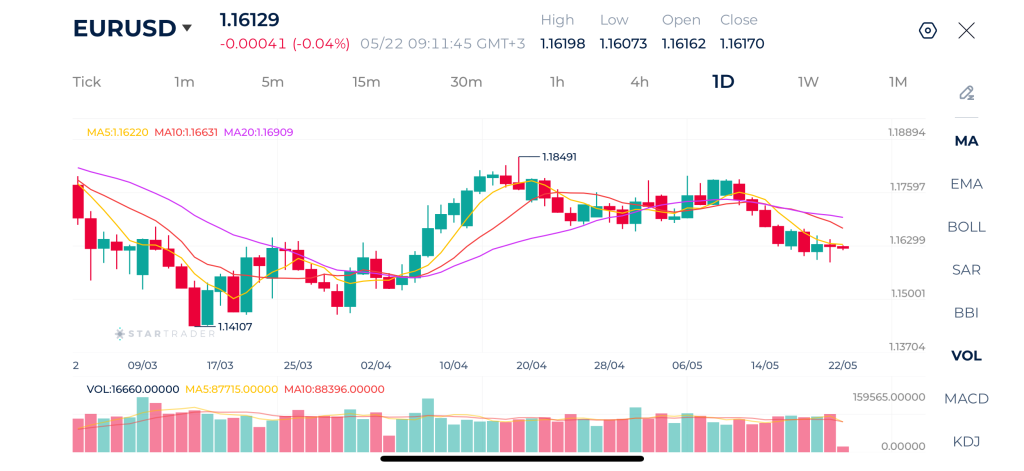
| Resistance | 1.1676 – 1.1685 | 1.1797 – 1.1820 | 1.1850 – 1.1867 |
| Support | 1.1577 – 1.1585 | 1.1500 – 1.1505 | 1.1411 – 1.1425 |
Risk Disclaimer: This material is provided for informational purposes only and does not constitute a recommendation or investment advice. Trading financial instruments on margin involves substantial risk and may not be appropriate for all investors.
Tags


Open Live Account
 Email Address
 Phone Number
Important Notice
STARTRADER does not accept any applications from Australian residents.
To comply with regulatory requirements, clicking the button will redirect you to the STARTRADER website operated by STARTRADER PRIME GLOBAL PTY LTD (ABN 65 156 005 668), an authorized Australian Financial Services Licence holder (AFSL no. 421210) regulated by the Australian Securities and Investments Commission.
Important Notice for Residents of the United Arab Emirates
In alignment with local regulatory requirements, individuals residing in the United Arab Emirates are requested to proceed via our dedicated regional platform at startrader.ae, which is operated by STARTRADER Global Financial Consultation & Financial Analysis L.L.C.. This entity is licensed by the UAE Capital Market Authority (CMA) under License No. 20200000241, and is authorised to introduce financial services and promote financial products in the UAE.
Please click the "Continue" button below to be redirected.


