


Key Takeaways
- S&P 500 and Nasdaq hit new record highs as investors welcomed earnings beats and hopes for a diplomatic solution in the Middle East.
- Japan’s Nikkei 225 touched record highs, supported by strong exports, improving manufacturing activity, and positive global risk sentiment.
- U.S. extends ceasefire deadline with Iran, but talks remained uncertain and the blockade of Iranian ports continued, keeping markets nervous.
- Oil prices jumped back above $100 as traders priced in prolonged supply risks and continued disruption around the Strait of Hormuz.
- Tesla earnings beat expectations as the company reported stronger-than-expected EPS, but revenue missed estimates.
- Bitcoin outperformed broader crypto markets, pushing toward the $80,000 level, while some altcoins lagged.
U.S. and Global Stock Continue Rising
U.S. equity markets showed remarkable resilience throughout the week. The Nasdaq once again led gains and broke above the 27,000 market, driven by continued strength in large-cap technology names and enthusiasm surrounding AI-related investment themes. Investors appear increasingly willing to reward companies with strong growth prospects, even in a high-uncertainty macro environment.
The S&P 500 also pushed to new records of 7,147, reflecting broad participation across sectors. Strong earnings from multiple industries, including financials, industrials, and technology, helped offset concerns over oil prices and geopolitical headlines. While volatility increased at times, buyers consistently returned on dips.
The Dow Jones Industrial Average also advanced during the week, although its gains were more moderate compared with the Nasdaq as the Dow reached 49,851. This reflected the index’s heavier weighting toward industrial and defensive names, which benefited less from the tech-driven rally but remained supported by earnings optimism.
Outside the United States, Japan stood out as one of the strongest performers. The Nikkei’s move to new highs above 60,000 highlighted improving investor confidence in Japanese growth prospects. Better trade data, strong manufacturing activity, and optimism surrounding global demand all contributed to the rally.
Tesla Earnings for Q1 2026 Beats Expectations
Tesla’s earnings report was one of the most closely watched corporate events of the week. The company delivered adjusted earnings above expectations, demonstrating that profitability remains intact despite growing competition in the electric vehicle market. However, revenue missed forecasts, highlighting continued pressure on deliveries and pricing.
The bigger story for investors was Tesla’s outlook. Management announced that spending this year would rise significantly above previous guidance as the company accelerates investment in AI-powered autonomous driving systems, humanoid robots, and next-generation manufacturing. While this reflects long-term ambition, it also raised concerns about near-term margins and free cash flow.
Oil Jumps Back Above $100 as The Strait of Hormuz Remains Closed
Oil was one of the most volatile assets this week. Crude prices climbed sharply and returned above $100 as geopolitical tensions resurfaced. The key driver remained the Strait of Hormuz. Any disruption in that region immediately raises fears of tighter supply and higher prices.
The extension of the ceasefire prevented immediate escalation, but the continuation of the U.S. blockade and uncertainty over peace talks kept risk premiums elevated in crude markets. Traders also considered the possibility that further conflict could damage infrastructure or prolong shipping disruptions.
For next week, oil is likely to remain highly sensitive to headlines. If negotiations progress, prices could retreat. If tensions escalate again, another sharp upward move is possible.
Gold and Silver Under Pressure as the US Dollar Strengthens
Gold struggled during the week as the precious metal faced pressure from a stronger U.S. dollar and firmer bond yields. As oil prices rose, markets began to reassess inflation risks. This reduced expectations for aggressive Federal Reserve easing and supported the dollar. Gold dropped around 2.5% during the week, falling below the $4,700 level. Silver was also under pressure as prices fell nearly 7% during the week to $74 an ounce.
Gold’s decline also reflected a shift in investor preference toward equities, particularly as stock indices reached record highs.
Next week, gold could remain volatile. If the dollar continues strengthening and yields rise further, upside may stay limited. However, weaker economic data could quickly revive demand for the metal.
Major Economic Calendar Events for the Upcoming Week
| Date | Metric | Country | Previous | Time [Dubai] |
| Monday, 27 April | German Retail Sales m/m | Euro | Tentative | |
| Tuesday, 28 April | Interest Rate Decision | Japan | <0.75% | Tentative |
| Tuesday, 28 April | CB Consumer Confidence | USA | 91.8 | 6:00 PM |
| Wednesday, 29 April | Consumer Price Index y/y | Australia | 3.70% | 5:30 AM |
| Wednesday, 29 April | Interest Rate Decision | Canada | 2.25% | 5:45 PM |
| Wednesday, 29 April | Federal Funds Rate | USA | 3.75% | 10:00 PM |
| Thursday, 30 April | Interest Rate Decision | UK | 3.75% | 3:00 PM |
| Thursday, 30 April | Interest Rate Decision | Euro | 2.15% | 4:15 PM |
| Thursday, 30 April | Core PCE Price Index m/m | USA | 0.40% | 4:30 PM |
| Friday, 1 May | Tokyo Core CPI y/y | Japan | 1.70% | 3:30 AM |
Technical Analysis and Forecast:
Brent Technical Analysis
Brent crude is trading near $105.64 after rejecting intraday highs around $107.37. On the daily chart, the broader structure remains constructive despite recent volatility. Price is holding above the daily averages MA5 and MA10, while MA20 is slightly below current price and flattening upward. This indicates that momentum has improved again after the mid-April pullback.
A sustained break above $107.37–$108.55 would strengthen bullish continuation signals and could open the path toward $110.00 and eventually retest the prior high zone.
Brent Daily Chart
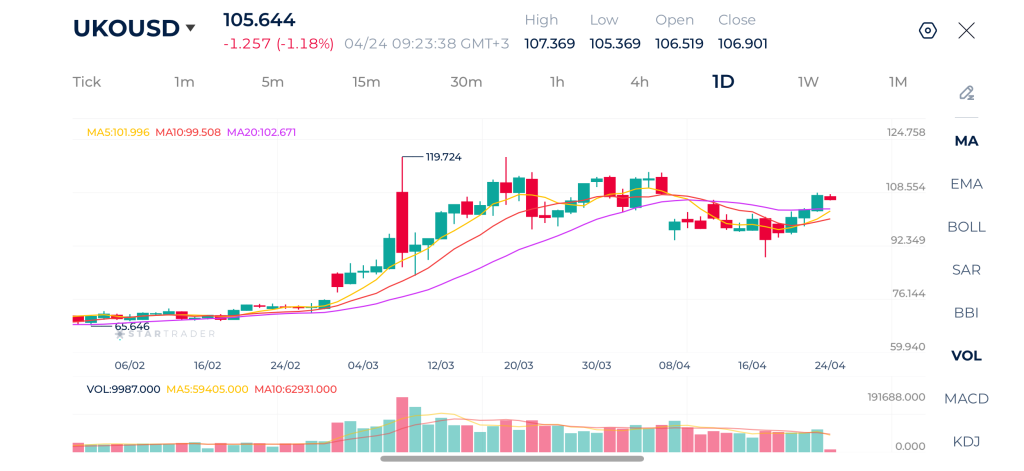
| Resistance | $107.37 –$108.55 | $110.00 – $111.24 | $113.54 – $114.00 |
| Support | $106.34 – $107.00 | $103.22 – $104.14 | $99.87 – $100.45 |
S&P 500 Technical Analysis
The S&P 500 is trading near 7,126 after reaching a fresh swing high at 7,155. The chart shows a powerful V-shaped recovery from the 6,318 low, followed by sustained upside momentum. Price remains comfortably above the daily averages MA5 , MA10, and MA20, signaling strong bullish control.
Immediate resistance is 7,155, then 7,200 and 7,230. If buyers reclaim momentum above the recent high, the trend could extend further. Support is located at 7,118, then 7,066, with stronger support around 6,985–6,950.
The recent candles show some consolidation near highs, which often reflects healthy digestion after a strong run.
Bias is bullish above 7,066. Trend remains positive unless support levels fail.
S&P 500 Daily Chart
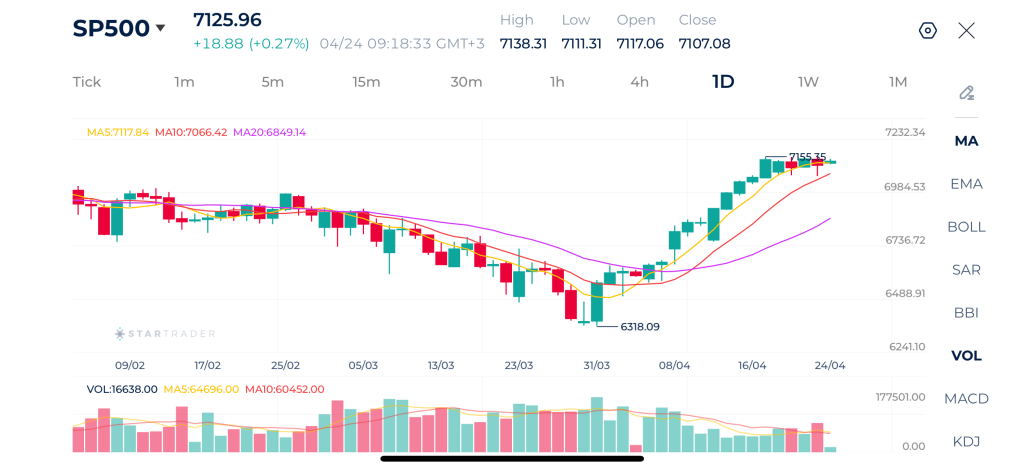
| Resistance | 7,155 – 7,172 | 7,200 – 7,230 | 7,245 – 7,260 |
| Support | 7,118 – 7,134 | 7,066 – 7,077 | 6,985 – 6,950 |
Gold Technical Analysis
Gold is trading near $4,679 after failing to sustain rebounds above the $4,775 zone. Price remains below the daily moving average MA10 and slightly below MA20, while MA5 is rolling lower. This indicates fading momentum and a market trapped in consolidation for the past several weeks.
Immediate resistance stands at $4,700–$4,717, then $4,765. Buyers need a break above these levels to improve sentiment. Support lies at $4,658, followed by $4,600, with stronger downside protection near $4,500.
Volume remains mixed, suggesting indecision. Until a breakout occurs, price may continue rotating inside a broad range.
Gold Daily Chart
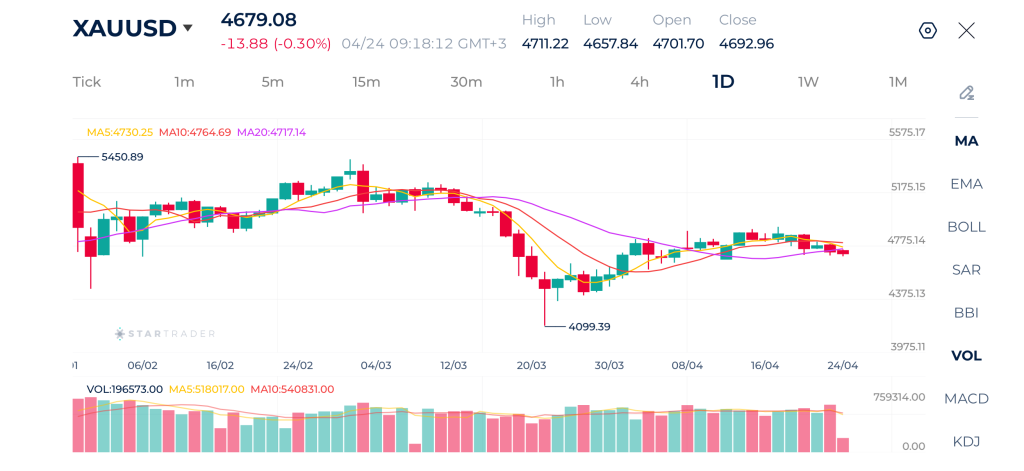
| Resistance | $4,700–$4,717, | $4,893 – $4,900 | $5,088 – $5,100 |
| Support | $4,600 – $4,658 | $4,500 – $4,521 | $4,258 – $4,300 |
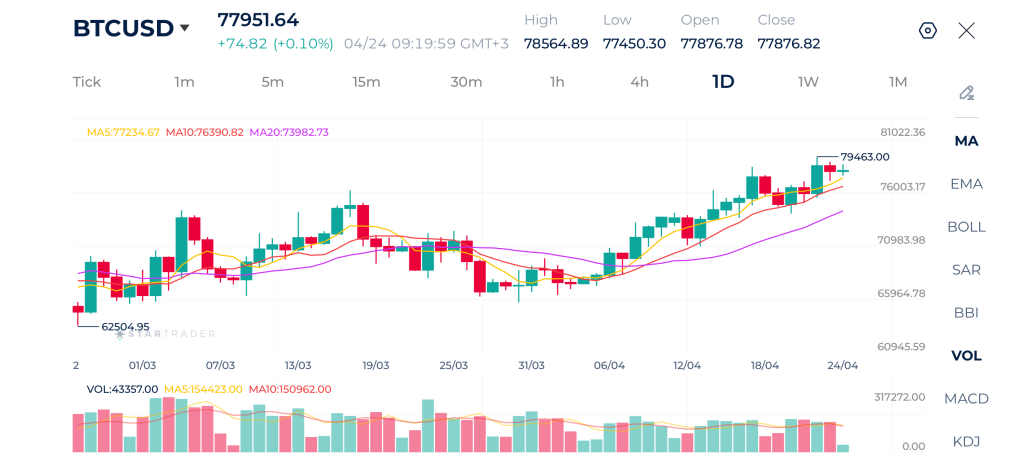
Bitcoin Technical Analysis
Bitcoin is trading around $77,900–$77,950 after reching a recent high at $79,463. The daily structure remains strongly bullish with a clear sequence of higher highs and higher lows since the early-April breakout. Price is holding above all key moving averages: MA5, MA10, and MA20 confirming trend strength.
The area between $79,400–$80,000 is the key resistance zone. A decisive daily close above $79,463 would confirm continuation and could open the path toward $81,000 and higher. On the downside, the first support sits at $77,200, then $76,000–$76,400, followed by stronger trend support near $74,000.
Bitcoin Daily Chart
| Resistance | $79,400–$80,000 | $83,664 – $84,286 | $85,523 – $85,837 |
| Support | $73,784 – $74,130 | $70,830 – $71,000 | $68,778 – $69,000 |
Risk Disclaimer: This material is provided for informational purposes only and does not constitute a recommendation or investment advice. Trading financial instruments on margin involves substantial risk and may not be appropriate for all investors.
Tags
Open Live Account
Please enter a valid country
No results found
No results found
Please enter a valid email
Please enter a valid verification code
1. 8-16 characters + numbers (0-9) 2. blend of letters (A-Z, a-z) 3. special characters (e.g, !a#S%^&)
Please enter the correct format
Please tick the checkbox to proceed
Please tick the checkbox to proceed
Important Notice
STARTRADER does not accept any applications from Australian residents.
To comply with regulatory requirements, clicking the button will redirect you to the STARTRADER website operated by STARTRADER PRIME GLOBAL PTY LTD (ABN 65 156 005 668), an authorized Australian Financial Services Licence holder (AFSL no. 421210) regulated by the Australian Securities and Investments Commission.
CONTINUEImportant Notice for Residents of the United Arab Emirates
In alignment with local regulatory requirements, individuals residing in the United Arab Emirates are requested to proceed via our dedicated regional platform at startrader.ae, which is operated by STARTRADER Global Financial Consultation & Financial Analysis L.L.C.. This entity is licensed by the UAE Capital Market Authority (CMA) under License No. 20200000241, and is authorised to introduce financial services and promote financial products in the UAE.
Please click the "Continue" button below to be redirected.
CONTINUEError! Please try again.

