








 Web Trader MT5









Key Takeaways:
- Oil prices surged as escalating tensions between the U.S. and Iran reignited fears of supply disruptions in the Middle East.
- Gold hovered near the $5,000 level, consolidating as it struggles to find direction.
- U.S. equity markets traded mixed, digesting economic data and details from the latest FOMC minutes.
- FOMC minutes showed internal division, with several policymakers favoring patience on further rate adjustments.
- The U.S. dollar strengthened modestly, supported by strong employment numbers.
Oil Jumps Almost 6% on Geopolitical Tensions
Oil was the standout performer this week. WTI crude rose 5.8%, climbing from around $63 to $66.65 per barrel at its peak. Brent reached its highest level since July 2025, gaining 6.3% during the week to reach $71.82.
The rally was driven by escalating tensions between the United States and Iran, raising concerns over potential supply disruptions in the Strait of Hormuz. Additionally, data from the US Energy Information Administration (EIA) showed that crude oil stocks plummeted by 9 million barrels last week, higher than market expectations of 2.1 million barrels.
Gold traded in a tight but elevated range, consolidating near $4,980–$5,020, finishing the week marginally higher by about 0.7%. Despite a slightly firmer dollar mid week, safe haven demand remained intact as geopolitical risks persisted. The $5,000 level continues to act as both a psychological barrier and a support zone during intraday volatility.
U.S. Stocks Trade Mixed as Investors Evaluated Fed Minutes
U.S. equity markets showed mixed performance during the week. S&P 500 rose 0.6%, closing near 6,900. Dow Jones was down less than 0.1%, holding near 49,500 level. And the Nasdaq 100 was up only 0.5% to 24,900, weighed down by tech profit-taking. The divergence among indices reflected sector rotation.
The latest FOMC minutes revealed a cautious tone. While policymakers acknowledged inflation progress, several members emphasized the need for further confirmation before adjusting rates again. A minority supported considering easing later in 2026, but consensus leaned toward patience. The minutes reduced expectations of imminent rate cuts, supporting bond yields and the dollar mid-week.
Looking forward, oil is likely to remain volatile. Any further escalation between the U.S. and Iran could push WTI toward $69 De-escalation could trigger a pullback toward $62 zone. For gold, continued consolidation around $5,000 is likely. A decisive break above could open the door toward $5,100, while support rests near $4,920.
Key Economic Data of the week:
- Canadian CPI inflation declined modestly to 2.7% on a yearly basis in January.
- Reserve Bank of New Zealand kept interest rates unchanged at 2.25% in line with expectations.
- CPI inflation in the UK cools to 3.0% on a yearly basis in January, down from 3.4% in December.
- The unemployment rate in Australia remains at 4.1%, better than market expectations of 4.2%
- Weekly unemployment claims in the US fell to 206K from 229K in the previous week.
Major Economic Calendar Events for the Upcoming Week
| Date | Metric | Country | Previous | Time [Dubai] |
| Monday, 23 February | Retail Sales q/q | New Zealand | 1.90% | 1:45 AM |
| Monday, 23 February | German IFO Business Climate | Euro | 87.6 | 1:00 PM |
| Tuesday, 24 February | CB Consumer Confidence | USA | 84.5 | 7:00 PM |
| Wednesday, 25 February | Consumer Price Index y/y | Australia | 3.80% | 4:30 AM |
| Wednesday, 25 February | Crude Oil Inventories | USA | 7:30 PM | |
| Thursday, 26 February | Unemployment Claims | USA | 5:30 PM | |
| Friday, 27 February | Tokyo Core CPI y/y | Japan | 2.00% | 3:30 AM |
| Friday, 27 February | Gross Domestic Product m/m | Canada | 0.00% | 5:30 PM |
| Friday, 27 February | Producer Price Inxex m/m | USA | 0.50% | 5:30 PM |
Technical Analysis and Forecast:
Brent Technical Analysis
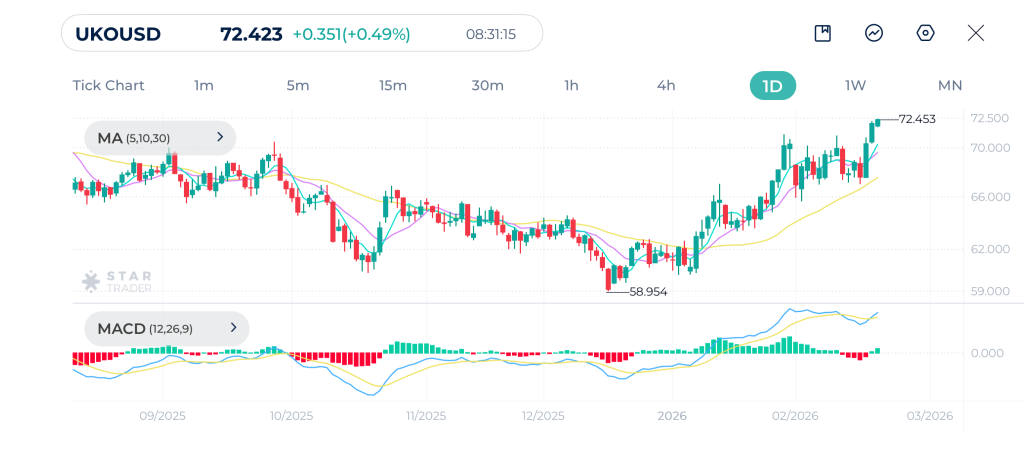
On the daily chart, Brent crude is in a clear medium term bullish recovery phase since the start of the year. Price has been logging consistent higher highs and higher lows, confirming a structural shift from bearish to bullish conditions. The short-term moving averages (5 and 10) are above the 30-period moving average, indicating sustained trend strength.
Price is now trading around $72.40, near recent highs, suggesting bullish continuation pressure. MACD is above the zero line, with momentum positive though slightly moderating.
As long as Brent holds above the $69.50–$70.00 support zone, the bullish structure remains intact. A daily close above $73.00 would likely open the door toward $75.00, while a break below $69.00 would signal a deeper corrective pullback toward $66.00–$67.00.
Brent Daily Chart
| Resistance | $72.79 – $73.00 | $74.21 – $74.43 | $76.00 – $76.14 |
| Support | $70.26 – $70.47 | $69.53 – $69.78 | $66.82 – $67.00 |
Gold Technical Analysis
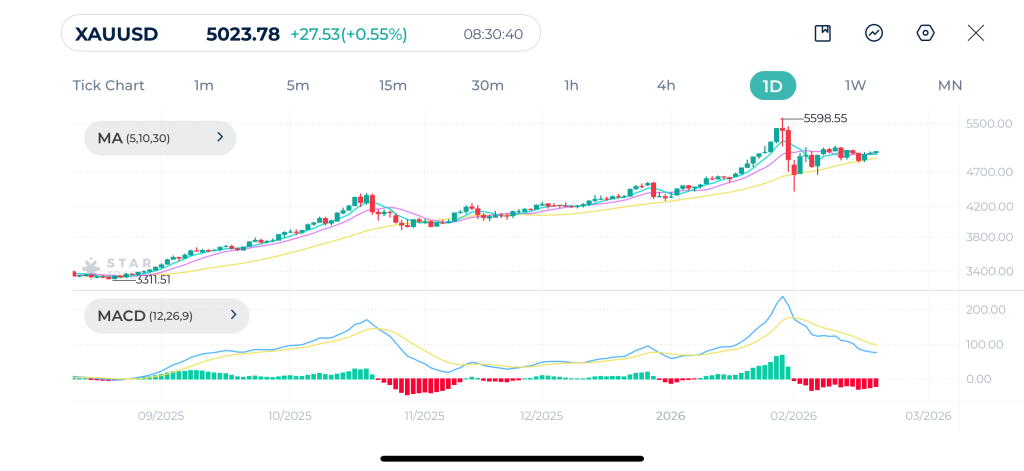
Gold remains in a strong long term uptrend, though momentum has clearly moderated after the spike toward $5,600 record high. The recent correction from the $5,600 high found support above the rising 30-day moving average, indicating that buyers are still defending trend structure. Price is currently consolidating around $5,020–$5,050.
MACD has rolled over from elevated levels and is slightly negative, reflecting cooling momentum. As long as gold remains above $4,900–$4,950, the bullish daily structure remains intact, with potential for a renewed move toward $5,600. A break below $4,850 would be the first stronger signal of a deeper correction toward $4,600.
Gold Daily Chart
| Resistance | $5,120 – $5,189 | $5,245 – $5,278 | $5,383 – $5,400 |
| Support | $4,839 – $4,878 | $4,783 – $4,810 | $4,630 – $4,690 |
Dow Jones Technical Analysis
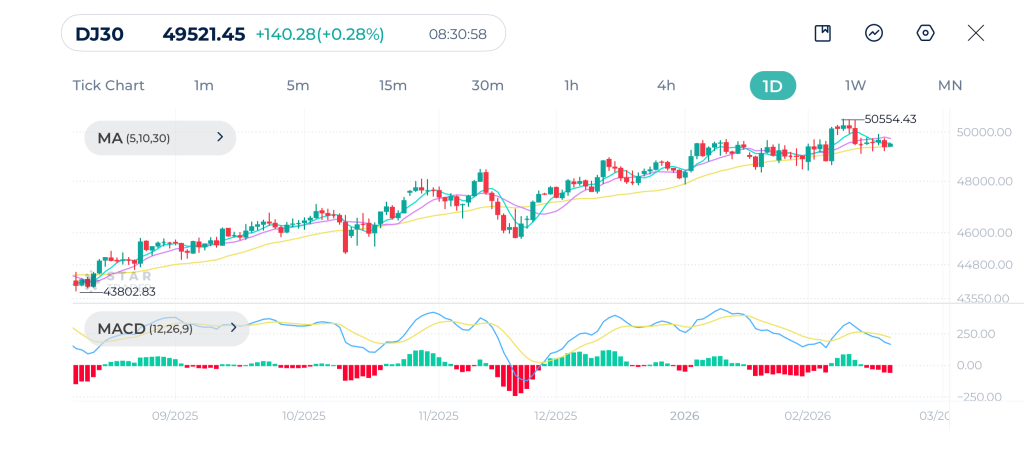
The broader trend remains upward on the Dow Jones despite recent consolidation.The index entered a mild corrective phase during the week, but remains above the 30-day moving average for now.
The shorter moving averages are flattening slightly, reflecting the recent sideways movement. MACD shows declining bullish momentum and is hovering near the zero line, suggesting that upside strength has cooled. Structurally, the 49,000–49,200 area acts as key support. Holding above that zone keeps the broader bullish structure valid and supports another attempt toward 50,500 and potentially new highs. A daily close below 48,800 would weaken momentum and shift the focus toward a deeper retracement.
Dow Jones Daily Chart
| Resistance | 49,900 – 50,030 | 50,237 – 50,305 | 50,489 – 50,524 |
| Support | 49,088 – 49,368 | 48,747 – 48,810 | 48,379 – 48,540 |
Bitcoin Technical Analysis
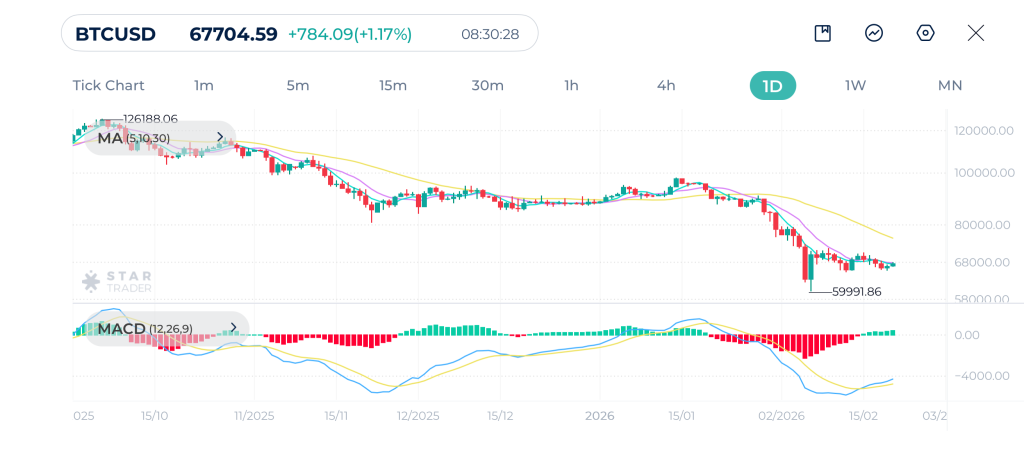
Bitcoin remains under medium term pressure despite the recent bounce from the $59,991 low. Price is trading below all three moving averages, and the 30-day moving average is sloping downward, confirming bearish trend alignment.
MACD has crossed slightly higher but remains below zero, indicating that bullish momentum is still weak and counter trend in nature. The $70,000–$75,000 zone is now strong resistance. Unless Bitcoin reclaims that region on a daily closing basis, the risk remains tilted to the downside. A break below $60,000 would likely accelerate selling pressure toward $55,000–$52,000, while sustained strength above $75,000 would be required to shift the daily structure back toward neutral or bullish.
Bitcoin Daily Chart
| Resistance | $69,837 – $70,265 | $72,291 – $72,410 | $75,213 – $75,390 |
| Support | $65,000 – $65,176 | $62,087 – $62,746 | $59,870 – $60,024 |
Tags


Open Live Account
 Email Address
 Phone Number
Important Notice
STARTRADER does not accept any applications from Australian residents.
To comply with regulatory requirements, clicking the button will redirect you to the STARTRADER website operated by STARTRADER PRIME GLOBAL PTY LTD (ABN 65 156 005 668), an authorized Australian Financial Services Licence holder (AFSL no. 421210) regulated by the Australian Securities and Investments Commission.
Important Notice for Residents of the United Arab Emirates
In alignment with local regulatory requirements, individuals residing in the United Arab Emirates are requested to proceed via our dedicated regional platform at startrader.ae, which is operated by STARTRADER Global Financial Consultation & Financial Analysis L.L.C.. This entity is licensed by the UAE Capital Market Authority (CMA) under License No. 20200000241, and is authorised to introduce financial services and promote financial products in the UAE.
Please click the "Continue" button below to be redirected.


