








 Web Trader MT5









Key Takeaways:
- Dow Jones and Nikkei reached fresh record highs, reflecting strong global equity momentum despite macro uncertainty.
- U.S. Non-Farm Payrolls (NFP) surprised to the upside, reinforcing labor market resilience and influencing Fed expectations.
- Cryptocurrency markets extended their decline, with Bitcoin and Ethereum under sustained selling pressure.
- The dollar index fell below 97.00, reacting to shifting rate expectations.
- Commodities showed mixed performance, with oil volatile and precious metals consolidating.
Dow Jones Pulls Back After Breaking a New Record High
U.S. equity markets delivered a bearish week overall. The Dow Jones Industrial Average fell approximately 1.8%, after reaching a new record above 50,517.
The S&P 500 lost roughly 1.7%, ending near 6,820 briefly nearing prior highs before dropping. Meanwhile, the Nasdaq 100 lost 1.7% to 24,643, as selling of software companies continued.
In Asia, the Nikkei 225 surged nearly 5%, reaching a fresh record above 58,015, driven by strong corporate earnings.
Strong U.S. NFP data, which showed job creation of approximately 130,000 versus expectations of 66,000 reinforced economic resilience but slightly reduced immediate expectations for aggressive Fed rate cuts.
Gold Fluctuates around $5,000
Gold moved between $4,880 – $5,120 during the week . Silver started the week strong before reversing downward on Thursday on strong selling pressure. Volatility remained elevated, reflecting speculative positioning adjustments.
Oil prices were volatile but ended lower, with WTI crude rising to $65 before ending the week around $62 a barrel. Brent rose above $70 on Wednesday before a sharp decline on Thursday that brought prices back toward $66.00
Cryptocurrencies Stay Under Pressure
The cryptocurrency market remained under heavy pressure throughout the week.
Bitcoin fell more than 5%, dropping toward $65,000. The decline reflects deteriorating risk appetite and continued deleveraging in derivatives markets. Ethereum declined roughly 7%, trading near $1,900 breaking below the psychological $2,000 level. Altcoins experienced deeper losses, with several major tokens down between 10–15%. The broader crypto market capitalization declined by an estimated -7% week-over-week, signaling ongoing fragility and risk aversion in digital assets.
Key Economic Data of the week
- Delayed US retail sales growth disappoints the market as it showed no improvement for the month of December.
- China’s producer price index showed a contraction of 1.4% on a yearly basis for January.
- Inflation cools in China to 0.2% on a monthly basis for January 2026.
- US Non-farm payrolls surprise to the upside, with 130K jobs added to the economy in the month of January.
- US unemployment showed a small improvement to 4.3%
- Weekly unemployment claims in the US rose slightly to 227K.
Major Economic Calendar Events for the Upcoming Week
| Date | Metric | Country | Previous | Time [Dubai] |
| Monday, 16 February | Eurogroup Meetings | Euro | All Day | |
| Tuesday, 17 February | Claimant Count Change | UK | 17.9K | 11:00 AM |
| Tuesday, 17 February | Consumer Price Index y/y | Canada | 2.80% | 5:30 PM |
| Wednesday, 18 February | Interest Rate Decision | New Zealand | 5:00 AM | |
| Wednesday, 18 February | Consumer Price Index y/y | UK | 3.40% | 11:00 AM |
| Wednesday, 18 February | FOMC Meeting Minutes | USA | 11:00 PM | |
| Thursday, 19 February | Unemployment Rate | Australia | 4.10% | 4:30 AM |
| Friday, 20 February | Advance GDP q/q | USA | 4.40% | 5:30 PM |
| Friday, 20 February | Core PCE Price Index m/m | USA | 0.20% | 5:30 PM |
| Friday, 20 February | Flash Manufacturing PMI | USA | 52.4 | 6:45 PM |
| Friday, 20 February | Flash Services PMI | USA | 52.7 | 6:45 PM |
Technical Analysis and Forecast:
Gold Technical Analysis
Gold remains in a broader long-term uptrend, but price action recently shows clear signs of corrective pressure. Price is currently trading above the 30-day moving average. This suggests a medium term bullish structure as the moving average is still upward sloping, which confirms that the primary trend has not yet shifted bearish.
The recent candles show consolidation around the $4,950–$5,000 zone after the sharp rejection. This area is acting as short term support. A daily close below $4,950 would likely expose $4,850 first, followed by the stronger support near $4,700–$4,720.
MACD has crossed bearish, indicating downside momentum is still active in the short term. However, this downward momentum is not accelerating aggressively.
If buyers regain control and reclaim $5,100 on a daily close, the structure shifts back toward bullish continuation targeting $5,200 and potentially a retest of $5,400–$5,600.
Gold Daily Chart
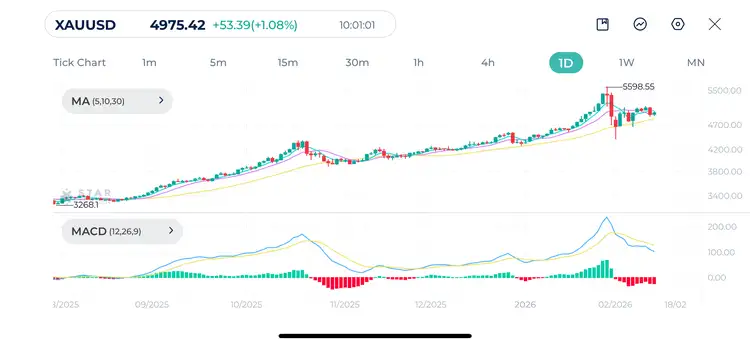
| Resistance | $5,100 – $5,120 | $5,255 – $5,270 | $5,380 – $5,400 |
| Support | $4,834 – $4,850 | $4,658 – $4,670 | $4,531 – $4,550 |
Dow Jones Technical Analysis
Dow Jones remains in a broader bullish trend, but momentum has clearly slowed. The structure on the daily chart shows a consistent sequence of higher highs and higher lows.
Price recently printed a new record high near 50,554, but the latest candles show hesitation and small candles, a sign of consolidation near resistance. Price remains above the 30-day moving average, and the shorer moving averages MA(5) and MA(10) are still positively aligned, which confirms trend strength. However, MACD is flattening and momentum is no longer expanding aggressively.
Immediate support lies near 49,000, followed by stronger support around 47,800–48,000. As long as price holds above the 30-day moving average on daily closes, the bullish trend remains intact.
Dow Jones Daily Chart
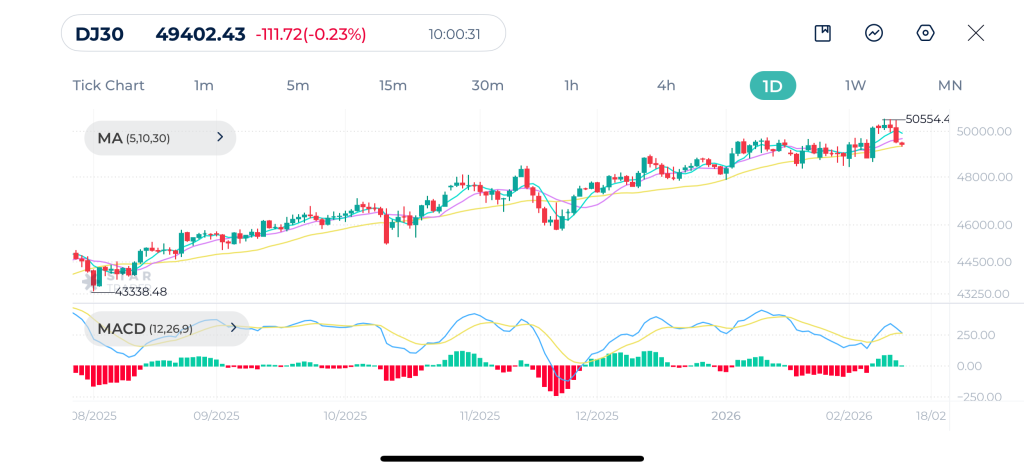
| Resistance | 49,640 – 49,663 | 49,870 – 49,889 | 50,000 – 51,118 |
| Support | 49,091 – 49,100 | 48,849 – 48,860 | 48,629 – 48,640 |
USDJPY Technical Analysis
USDJPY shows a transition phase after a strong decline from the 159.448 high. The broader structure since that peak is bearish, with price forming lower highs and breaking below key moving averages.
Currently, price is trading below the 30-day moving average, which is turning downward, a sign that medium term trend pressure is bearish. The rebound toward 153.50 looks corrective and is approaching dynamic resistance from the moving averages.
Key resistance sits between 154.50–155.00. If price fails here and forms bearish rejection candles, the pair could retest 152.20 and potentially 151.00. MACD remains negative, and showing bearish momentum is slowing but not yet reversing.
A daily close above 155.50 would be the first technical sign that sellers are losing control.
USDJPY Daily Chart
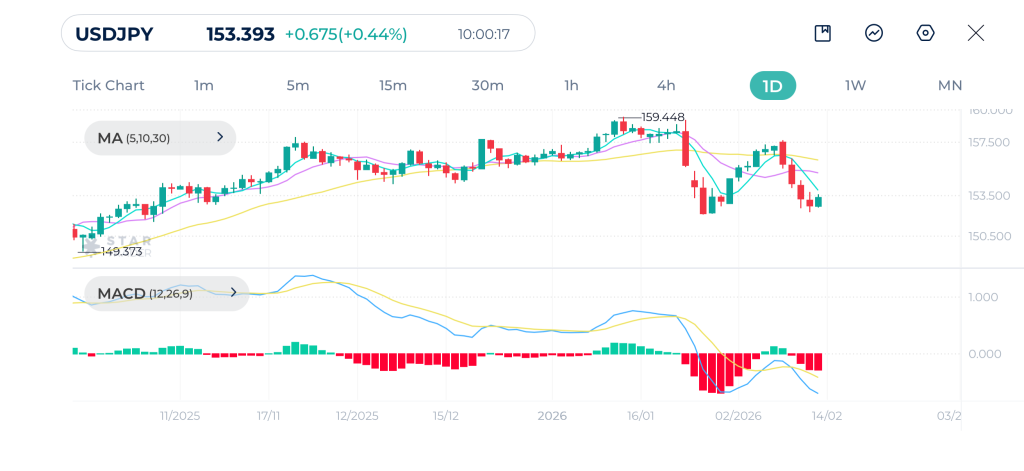
| Resistance | 154.74 – 154.90 | 155.94 – 156.00 | 156.88 – 157.00 |
| Support | 152.19 – 152.35 | 151.58 – 151.70 | 150.40 – 150.55 |
Bitcoin Technical Analysis
Bitcoin remains structurally bearish on the daily timeframe. Price is trading below all key moving averages (5, 10, and 30), and all three are sloping downward. This confirms a strong bearish trend environment.
The $60,000 area remains key structural support. A daily close below this level could trigger a continuation toward $55,000–$52,000.
On the upside, resistance is clearly defined at around $70,000–$72,000, where the price previously broke down. Only a daily close above the 30-day moving average and a break above $75,000 would begin to invalidate the bearish structure.
Bitcoin Daily Chart
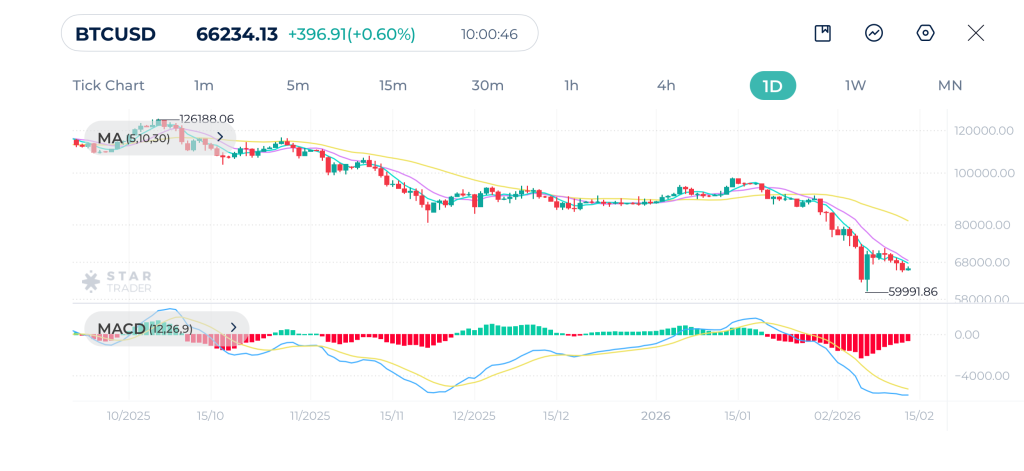
| Resistance | $70,566 – $70.621 | $75,645 – $75,700 | $79,229 – $80,000 |
| Support | $62,948 – $63,000 | $60,160 – $60,232 | $58,019 – $58,100 |
Tags


Open Live Account
 Email Address
 Phone Number
Important Notice
STARTRADER does not accept any applications from Australian residents.
To comply with regulatory requirements, clicking the button will redirect you to the STARTRADER website operated by STARTRADER PRIME GLOBAL PTY LTD (ABN 65 156 005 668), an authorized Australian Financial Services Licence holder (AFSL no. 421210) regulated by the Australian Securities and Investments Commission.
Important Notice for Residents of the United Arab Emirates
In alignment with local regulatory requirements, individuals residing in the United Arab Emirates are requested to proceed via our dedicated regional platform at startrader.ae, which is operated by STARTRADER Global Financial Consultation & Financial Analysis L.L.C.. This entity is licensed by the UAE Capital Market Authority (CMA) under License No. 20200000241, and is authorised to introduce financial services and promote financial products in the UAE.
Please click the "Continue" button below to be redirected.


