


Key Takeaways
- The Federal Reserve kept rates unchanged but delivered a hawkish message, signaling at least one potential rate hike in 2026.
- The US Dollar Index reclaimed the 100.00 level as markets priced out expectations for future rate cuts.
- Gold rallied early in the week on peace-deal optimism before reversing lower following the Fed meeting.
- The US-Iran peace agreement and reopening of the Strait of Hormuz triggered a sharp decline in oil prices, removing much of the war-related risk premium.
- Japan’s Nikkei and South Korea’s Kospi reached new all-time highs, extending the global AI-driven equity rally.
- SpaceX experienced significant volatility, soaring above $225 before retreating to around $173.
Federal Reserve Delivers a Hawkish Hold
As widely expected, the Federal Reserve left interest rates unchanged at 3.50%-3.75%. However, the surprise came from the updated dot plot and policy guidance. Policymakers now project the federal funds rate ending 2026 around 3.8%, signaling that at least one rate hike remains possible next year rather than the easing cycle many investors had anticipated.
The market reaction was immediate. The US Dollar Index (DXY) surged back above the psychological 100.00 level. Treasury yields moved higher. Gold came under pressure, falling below $4,200 after its early-week rally. Major US indices sold off following the announcement.
As inflation risks remain elevated, policymakers are not yet comfortable discussing rate cuts.
In the stock market, SpaceX surged above $225 during the week amid strong enthusiasm surrounding the company’s AI, satellite, and space infrastructure businesses. However, profit-taking and broader market volatility later triggered a sharp pullback, with shares falling toward $173 by week’s end.
US-Iran Peace Agreement Ends Months of Conflict
The second major development during the week was the signing of a peace agreement between the United States and Iran, effectively ending the Gulf conflict and giving hopes of reopening the Strait of Hormuz. The deal includes sanctions relief for Iran and the normalization of oil shipments through one of the world’s most important energy corridors.
This major develoment removed a substantial geopolitical risk premium from crude oil prices. Brent crude fell toward $77 per barrel. WTI declined toward the mid-$70s. Oil prices are now approaching levels seen before the outbreak of the conflict, and crude is on track for roughly a 9-10% weekly decline.
Gold initially benefited from optimism surrounding the peace agreement and expectations of easier financial conditions. However, the Fed’s hawkish stance quickly reversed those gains, pushing bullion lower as the stronger dollar and rising yields reduced the appeal of non-yielding assets.
Asian Equity Markets Continue Their Historic Rally
Japanese equities extended their remarkable rally. The Nikkei 225 jumped above 71,000 for the first time in history following the Bank of Japan’s decision and improving global risk sentiment.
South Korea’s Kospi also continued its historic advance, reaching new all-time highs and trading above the 9,000 level for the first time. Strong gains in technology and AI-related shares continued to attract global capital into the market.
Key Economic Data of the week
| Date | Metric | Country | Previous | Time [Dubai] |
| Monday, 22 June | Consumer Price Index y/y | Canada | 2.50% | 4:30 PM |
| Tuesday, 23 June | Flash Manufacturing PMI | Euro | 51.6 | 12:00 PM |
| Tuesday, 23 June | Flash Services PMI | Euro | 46.4 | 12:00 PM |
| Tuesday, 23 June | Flash Manufacturing PMI | UK | 53.9 | 12:30 PM |
| Tuesday, 23 June | Flash Services PMI | UK | 47.9 | 12:30 PM |
| Tuesday, 23 June | Flash Manufacturing PMI | USA | 55.1 | 5:45 PM |
| Tuesday, 23 June | Flash Services PMI | USA | 50.9 | 5:45 PM |
| Wednesday, 24 June | Consumer Price Index y/y | Australia | 4.20% | 5:30 AM |
| Thursday, 25 June | Unemployment Rate | Australia | 4.50% | 5:30 AM |
| Thursday, 25 June | Core PCE Price Index m/m | USA | 0.20% | 4:30 PM |
| Thursday, 25 June | Final GDP q/q | USA | 1.60% | 4:30 PM |
| Friday, 26 June | Tokyo Core CPI y/y | Japan | 1.30% | 3:30 AM |
Technical Analysis and Forecast:
Gold Technical Analysis
Gold remains under bearish pressure after extending its decline below the $4,200 level. The precious metal continues to trade beneath all major moving averages, with the 5-day and 10-day averages maintaining a negative slope below the 20-day moving average. This configuration confirms that momentum remains firmly tilted to the downside.
The broader trend has deteriorated significantly since the rejection from the historic high near $5,600. Since then, gold has consistently posted lower highs and lower lows, while repeated attempts to recover have been capped by descending moving averages. The recent rebound from the $4,023 support zone failed to generate sustainable buying interest, resulting in another wave of selling pressure.
The key support area remains near $4,020–4,050. A decisive break below this region would reinforce the bearish outlook and potentially trigger a move toward the psychological $4,000 level. On the upside, resistance is now located around $4,250, followed by stronger resistance near the 20-day moving average around $4,355. Only a sustained recovery above these levels would suggest that downside momentum is beginning to fade. Until then, the technical outlook remains bearish, with sellers maintaining control of the market structure.
Gold Daily Chart
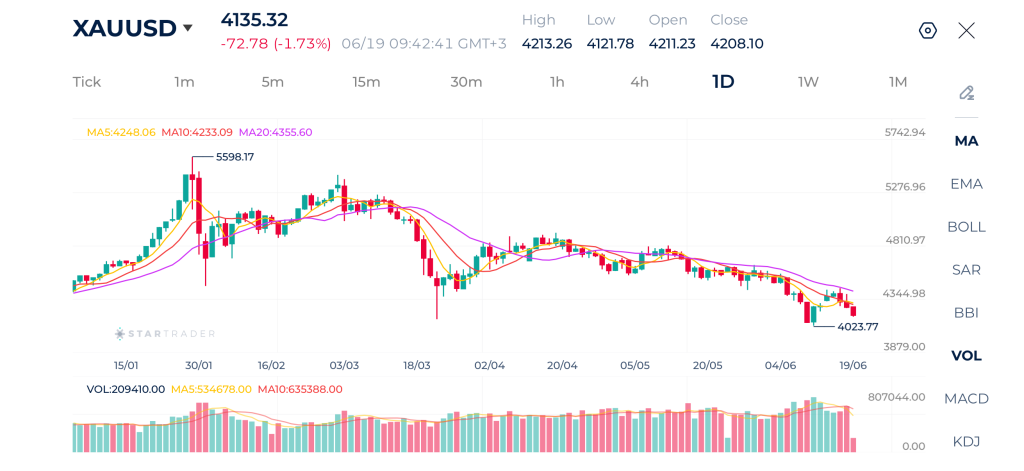
| Resistance | $4,250 – $4,275 | $4,355 – $4,370 | $4,410 – $4,425 |
| Support | $4,020 – $4,050 | $3,934 – $3,950 | $3,886 – $3,900 |
Brent Technical Analysis
Brent crude remains in a bearish trend despite a modest rebound from recent lows. The 5-day moving average remains below the 10-day average, while both are significantly below the 20-day average, highlighting the strength of the prevailing downtrend.
The market continues to be influenced by expectations of easier supply following the US-Iran peace agreement and the reopening of the Strait of Hormuz.
Immediate resistance is located around $82–83, followed by the more significant barrier near the 20-day moving average around $91.90. On the downside, the recent low near $77.80 remains critical support. A break below this level would confirm a continuation of the broader bearish trend and potentially expose the next target near $75.00.
Brent Daily Chart
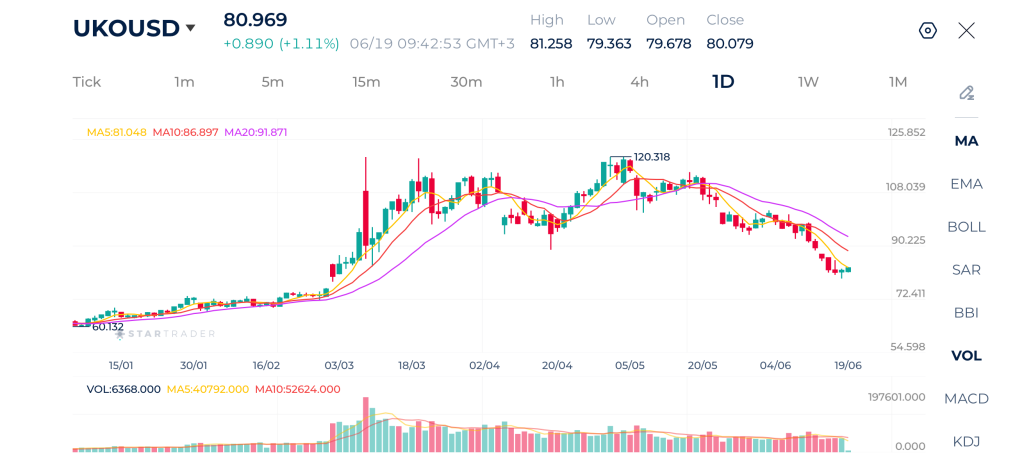
| Resistance | $82.00 – $82.15 | $85.72 – $85.90 | $88.84 – $89.00 |
| Support | $76.36 – $76.50 | $73.60 – $73.75 | $71.50 – $71.75 |
Nasdaq 100 Technical Analysis
The Nasdaq 100 continues to trade within a strong long-term uptrend despite the recent pullback following the Federal Reserve meeting. The index remains comfortably above its 20-day moving average, while the shorter-term moving averages continue to hold above the longer-term trend line, confirming that the broader bullish structure remains intact.
The 30,800 area remains the key resistance level. A decisive breakout above this barrier would likely signal a continuation of the broader uptrend and open the door toward 31,500. On the downside, initial support is located around 29,900–30,000, followed by stronger support near the 20-day moving average around 29,940. As long as the index remains above these support levels, the longer-term outlook continues to favor the bulls despite near-term volatility surrounding monetary policy expectations.
Nasdaq 100 Daily Chart
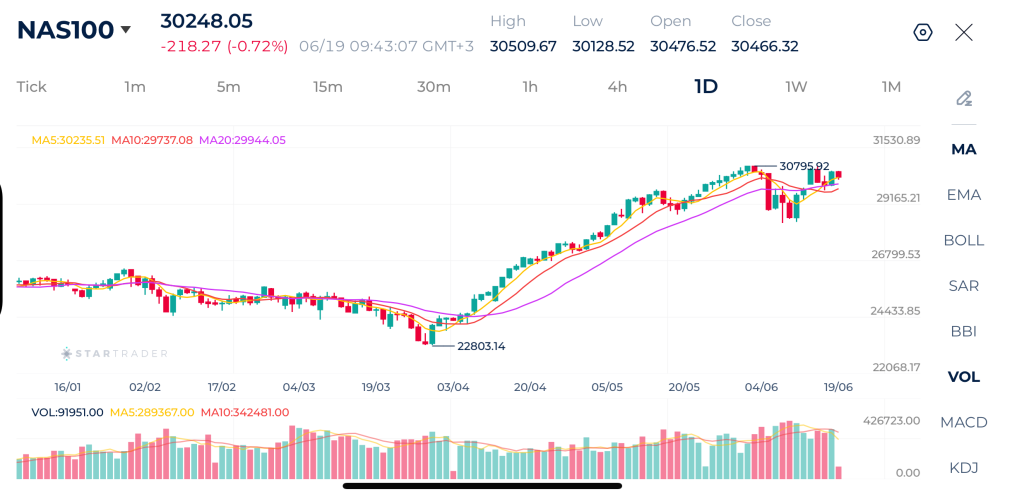
| Resistance | 30,600 – 30,657 | 30,800 – 30,824 | 31,500 – 31,527 |
| Support | 29,629 – 29,700 | 29,233 – 29,350 | 28,550 – 28,670 |
EURUSD Technical Analysis
EURUSD remains under bearish pressure after extending its decline below the 1.1450 area and reaching its lowest level since late March. The pair has now broken beneath the 5-day, 10-day, and 20-day moving averages, which are aligned in a bearish configuration with the shorter-term averages crossing below the longer-term trend indicator. This alignment reflects increasing downside momentum and confirms that sellers remain in control of the broader trend.
The recent rejection from the 1.1750–1.1800 resistance zone marked a significant lower high within the medium-term structure. Since then, the pair has produced a series of lower highs and lower lows, signaling a continuation of the bearish trend. The sharp decline during the latest sessions also came with an increase in selling pressure, suggesting that market participants are actively positioning for further weakness rather than merely taking profits.
From a support perspective, the immediate focus is on the 1.1400 psychological level, which coincides with the March swing low around 1.1410. A sustained break below this zone could expose the next downside target near 1.1300. On the upside, any recovery would first need to reclaim the 1.1500 area before challenging resistance near 1.1580 and the descending 20-day moving average around 1.1575. As long as the pair remains below these levels, the broader bias remains negative.
EURUSD Daily Chart
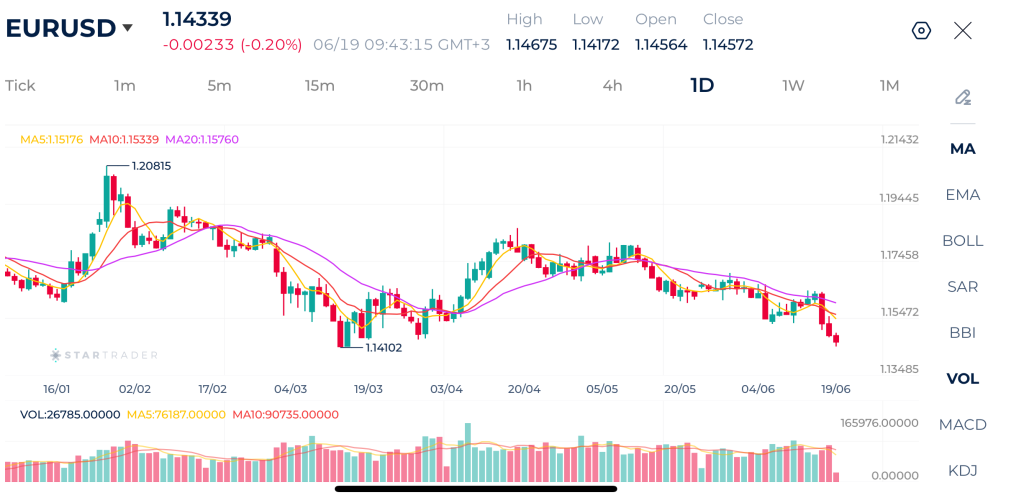
| Resistance | 1.1505 – 1.1514 | 1.1620 – 1.1645 | 1.1685 – 1.1700 |
| Support | 1.1400 – 1.1412 | 1.1349 – 1.1360 | 1.1208 – 1.1215 |
Risk Disclaimer: This material is provided for informational purposes only and does not constitute a recommendation or investment advice. Trading financial instruments on margin involves substantial risk and may not be appropriate for all investors.
Tags
Open Live Account
Please enter a valid country
No results found
No results found
Please enter a valid email
Please enter a valid verification code
1. 8-16 characters + numbers (0-9) 2. blend of letters (A-Z, a-z) 3. special characters (e.g, !a#S%^&)
Please enter the correct format
Please tick the checkbox to proceed
Please tick the checkbox to proceed
Important Notice
STARTRADER does not accept any applications from Australian residents.
To comply with regulatory requirements, clicking the button will redirect you to the STARTRADER website operated by STARTRADER PRIME GLOBAL PTY LTD (ABN 65 156 005 668), an authorized Australian Financial Services Licence holder (AFSL no. 421210) regulated by the Australian Securities and Investments Commission.
CONTINUEImportant Notice for Residents of the United Arab Emirates
In alignment with local regulatory requirements, individuals residing in the United Arab Emirates are requested to proceed via our dedicated regional platform at startrader.ae, which is operated by STARTRADER Global Financial Consultation & Financial Analysis L.L.C.. This entity is licensed by the UAE Capital Market Authority (CMA) under License No. 20200000241, and is authorised to introduce financial services and promote financial products in the UAE.
Please click the "Continue" button below to be redirected.
CONTINUEError! Please try again.

