








 Web Trader MT5











Key Takeaways:
- Silver surged to a new record high at $66.91, driven by a weaker U.S. dollar, and strong safe haven and industrial demand.
- The Bank of Japan raised its benchmark interest rate to 0.75%, the highest level in nearly 30 years, signaling continued policy normalization.
- Sell-offs in Japanese government bonds pushed long-term yields to multi-decade highs.
- Bitcoin fell below $85,000, reflecting reduced risk appetite and sensitivity to global monetary tightening signals.
- Ethereum dropped below $2,800, underperforming as investors continued to rotate away from higher-beta digital assets.
- Overall market sentiment turned more cautious, as tightening in Japan contrasted with easing expectations in the U.S., creating cross-market volatility.
U.S. Stock Market & Indices Performance
U.S. equities traded mixed throughout the week. The S&P 500 and Dow Jones hovered near record levels, supported by the outlook for lower interest rates and stable macro conditions. However, both indices closed lower for the week. Dow Jones declined 1.38% to 47,797. S&P500 dropped to 6,717 during, but later stabilized around 6,779.
At the same time, the Nasdaq dropped 2% during the week, before it bounced back up on Wednesday to end the week around the 25,100 level. Profit taking in large-cap technology and AI-related stocks weighed on performance, as investors reassessed valuations following a strong multi-week rally. This divergence indicated rotation, with capital shifting toward value and income-generating stocks.
Overall, the equity market tone remained constructive. Pullbacks are likely temporary, volatility stayed contained, and investor confidence appeared intact as markets transitioned from policy-driven momentum to more selective positioning.
Silver Breaks a New All-Time High, and Gold Nears Previous Record
Gold prices remained well supported near historic levels, consolidating after strong gains earlier in the month. Falling real yields and continued weakness in the U.S. dollar provided a supportive backdrop, while lingering macro and geopolitical uncertainty sustained safe-haven demand.
Gold continued to benefit from expectations of easier monetary conditions extending into 2026. The precious metal gained 1.8% to reach a weekly high of $4,376 per ounce, before retreating back to $4,320 on Friday.
Silver tracked gold’s performance but with greater volatility While short-term price swings were more pronounced, silver remained structurally supported by improving liquidity conditions and medium-term industrial demand expectations. On Wednesday, silver reached a new record high of $66.91 before prices stabilized and ended the week around the $66 level.
The US Dollar Bounces Back Despite Fed Loose Monetary Policy
EUR/USD started the week on solid grounds, supported by broad U.S. dollar weakness and narrowing interest-rate differentials between the Fed and the European Central Bank. The pair broke above 1.1800 on Tuesday, but for the remainder of the week, it reversed direction and fell to 1.1700.
USD/JPY also experienced fluctuation during the week. The pair dropped 1% before it bounced back up and broke above 156.80 following the decision from the Bank of Japan to raise its benchmark interest rate by 25 basis points to 0.75%, the highest level in nearly 30 years, as it continues to normalize monetary policy. While the move was widely expected, the Bank of Japan signaled it remains open to further tightening, even as it stressed that real interest rates will stay deeply negative and financial conditions accommodative.
Inflation remains above target, with consumer prices rising 2.9% in November, marking 44 consecutive months above the BOJ’s 2% goal. However, the central bank expects core inflation to dip below target in 2026 as food prices cool and government measures take effect. At the same time, real wages have been declining for ten straight months, highlighting ongoing pressure on households.
Key Economic Data of the week:
- Consumer Price Index in Canada rises slightly to 2.8% on a yearly basis from 2.7%, in line with expectations.
- UK’s unemployment rate ticks higher to 5.1% in October
- Non-Farm Payrolls showed the US economy lost 105K jobs in October, but gained 64K in November, reflecting weakness in the labor market.
- US unemployment rate jumps to 4.6%, higher than consensus of 4.5%
- Consumer inflation cools to 3.2% in the UK for the month of November, down from the previous reading of 3.6% in October
- Bank of England cuts its policy rate by 25 basis points to 3.75% in line with expectations.
- US consumer inflation falls to 2.7% in November on a yearly basis from 3% in October
- Bank of Japan raises interest rates by 25 basis points to 0.75%
Major Economic Calendar Events for the Upcoming Week:
| Date | Metric | Country | Previous | Time [Dubai] |
| Monday, 22 December | Final GDP q/q | UK | 0.10% | 11:00 AM |
| Tuesday, 23 December | ADP Weekly Employment Change | USA | Tentative | |
| Tuesday, 23 December | Gross Domestic Product m/m | Canada | 0.20% | 5:30 PM |
| Tuesday, 23 December | Preliminary Gross Domestic Product q/q | USA | 5:30 PM | |
| Tuesday, 23 December | CB Consumer Confidence | USA | 88.7 | 7:00 PM |
| Tuesday, 23 December | Richmond Manufacturing Index | USA | -15 | 7:00 PM |
| Wednesday, 24 December | Unemployment Claims | USA | 5:30 PM | |
| Thursday, 25 December | Housing Starts y/y | Japan | 3.20% | 9:00 AM |
| Friday, 26 December | Unemployment Rate | Japan | 2.60% | 3:30 PM |
Technical Analysis and Forecast:
Dow Jones Technical Analysis
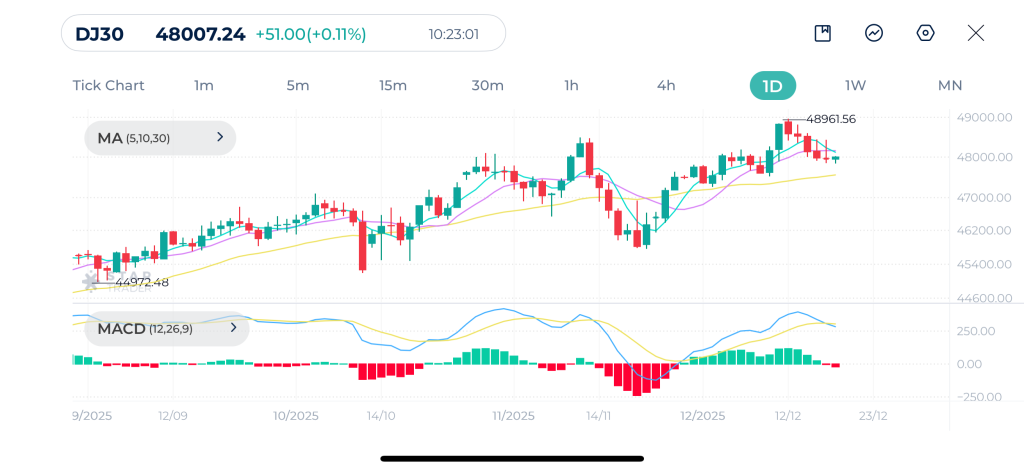
Dow Jones remains in a primary bullish trend on the daily timeframe, as prices continue to trade above the 30-day moving average, which is still sloping upward. The recent pullback reflects a bearish corrective wave with price finding support around 47,800–47,600. The structure of higher highs and higher lows remains intact, suggesting that the broader uptrend is not yet broken.
MACD shows a cooling phase, and reflects a loss of upside momentum. As long as MACD remains above or near the zero line, this pullback can be interpreted as consolidation before a potential continuation higher.
Key resistance is located near 48,950–49,000, which represents the recent swing high and psychological round number. A daily close above this zone would open the door for trend continuation. On the downside, immediate support sits around 47,800, followed by a stronger support zone near 47,200–47,000, where the rising 30-day MA and prior demand converge. A sustained break below that area would be the first technical warning of deeper correction.
Dow Jones Daily Chart
| Resistance | 48,391 – 48,483 | 48,609 – 48,630 | 48,779 – 48,889 |
| Support | 47,454 – 47,523 | 47,200 – 47,266 | 46,581 – 46,664 |
Gold Technical Analysis
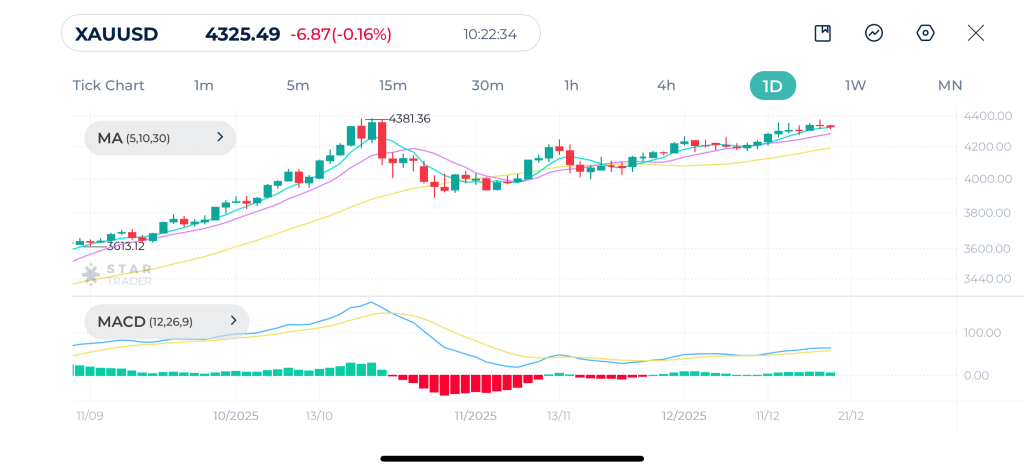
Gold remains in a strong long-term bullish trend, with price holding well above the 30-day moving average, which continues to slope upward. The recent consolidation below the 4,380 high looks like a healthy pause after an extended rally. Importantly, price action continues to respect dynamic support, indicating buyers are still in control.
MACD supports this bullish bias, as momentum remains positive and above the zero line, despite some flattening.
Immediate resistance is found around $4,380 which is the all-time high of the precious metal. A clean daily close above this zone would confirm trend continuation toward higher targets. On the downside, first support lies near $4,250, followed by a stronger structural support zone around $4,100–$4,050, aligned with the rising 30-day moving average. As long as gold holds above these levels, the bullish trend remains intact.
Gold Daily Chart
| Resistance | $4,375 – $4,380 | $4,397 – $4,400 | $4,400 – $4,412 |
| Support | $4,300 – $4,305 | $4,258 – $4,270 | $4,200 – $4,205 |
GBPUSD Technical Analysis
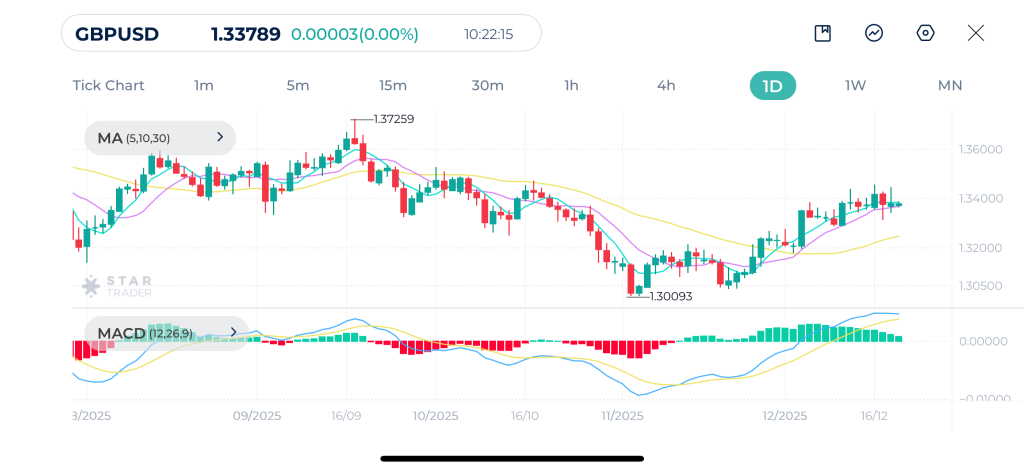
GBPUSD appears to be transitioning from a corrective phase into a potential bullish recovery. After forming a clear base near the 1.3010–1.3050 zone, price has reclaimed the short-term moving averages and is now trading above the 10- and 30-day moving averages. This shift suggests improving bullish structure following the previous downtrend.
MACD has crossed into positive territory, with the histogram expanding to the upside. This indicates strengthening bullish momentum and supports the idea that the pair may attempt a broader trend reversal.
Key resistance is located around 1.3450–1.3500. A daily close above this area would significantly strengthen the bullish case and open the door toward higher levels. On the downside, immediate support rests near 1.3300, with stronger structural support at 1.3150–1.3100. As long as price holds above these zones, the recovery scenario remains valid.
GBPUSD Daily Chart
| Resistance | 1.3456 – 1.3462 | 1.3527 – 1.3538 | 1.3621 – 1.3631 |
| Support | 1.3313 – 1.3320 | 1.3275 – 1.3286 | 1.3235 – 1.3242 |
Tags


Open Live Account
 Email Address
 Phone Number
Important Notice
STARTRADER does not accept any applications from Australian residents.
To comply with regulatory requirements, clicking the button will redirect you to the STARTRADER website operated by STARTRADER PRIME GLOBAL PTY LTD (ABN 65 156 005 668), an authorized Australian Financial Services Licence holder (AFSL no. 421210) regulated by the Australian Securities and Investments Commission.
Important Notice for Residents of the United Arab Emirates
In alignment with local regulatory requirements, individuals residing in the United Arab Emirates are requested to proceed via our dedicated regional platform at startrader.ae, which is operated by STARTRADER Global Financial Consultation & Financial Analysis L.L.C.. This entity is licensed by the UAE Capital Market Authority (CMA) under License No. 20200000241, and is authorised to introduce financial services and promote financial products in the UAE.
Please click the "Continue" button below to be redirected.


