


Key Takeaways
- Dow Jones outperforms as investors rotate from growth stocks into value oriented sectors.
- The AI-driven rally is facing a new test, with Broadcom’s results triggering concerns about technology valuations.
- Asian markets remain fundamentally strong but are showing signs of exhaustion after reaching record highs.
- Geopolitical developments involving the US and Iran continue to be the primary driver of short-term moves in oil and gold markets.
- Crypto markets remain highly sensitive to ETF flows and leverage conditions, resulting in extreme volatility.
U.S. Markets: Dow Jones Hits New Record While Tech Rally Pauses
U.S. equities delivered a mixed performance this week. The biggest highlight was the Dow Jones Industrial Average, which surged to a fresh all-time high above 51,600, supported by strong gains in financials, healthcare, and industrial stocks. Investors rotated away from high-growth technology names and into more defensive sectors amid growing concerns about AI valuations and the broader economic outlook.
Meanwhile, the S&P 500 and Nasdaq Composite retreated from their recent record highs. The pullback was largely driven by weakness in semiconductor stocks following disappointing guidance from Broadcom. Broadcom shares fell more than 12%, triggering a broader selloff across the AI-related technology sector and raising questions about whether the extraordinary AI-driven rally can continue at the same pace. By the end of the week, the S&P 500 was around 7,545, while the Nasdaq slipped despite strength in other sectors.
Commodities: Oil and Gold Swing on Iran Headlines
Oil and gold prices remained highly volatile as traders attempted to assess conflicting signals surrounding U.S.-Iran negotiations and the broader geopolitical situation in the Middle East.
Crude oil initially found support from concerns that tensions could disrupt energy supplies passing through the Strait of Hormuz. However, reports suggesting possible progress toward de-escalation later in the week weighed on prices and limited further gains.
Gold experienced similar volatility. The precious metal benefited from safe-haven demand whenever geopolitical concerns intensified but came under pressure when optimism emerged regarding potential diplomatic progress. Gold eventually rebounded toward the end of the week as investors sought protection against uncertainty and softer U.S. dollar conditions.
Cryptocurrency Market: Heavy Liquidations Hit Bitcoin and Ethereum
The cryptocurrency market suffered one of its sharpest weekly declines of 2026. Bitcoin fell below the critical $62,000 leve. Ethereum also came under significant pressure, dropping toward the $1,700 area. More than $1.5 billion worth of leveraged long positions were liquidated across the crypto market as falling prices triggered a cascade of forced selling.
Several factors contributed to the selloff including continued outflows from U.S. spot Bitcoin ETFs, increased risk aversion due to geopolitical uncertainty, and more importantly the announcement by Strategy that it sold 32 Bitcoin between May 26 and May 31. While the sale itself was relatively small, it negatively affected market sentiment and fueled concerns about institutional conviction.
Forecast for the Week Ahead (June 8–12, 2026)
Looking ahead, markets are likely to focus on three major themes.
First, investors will closely watch upcoming U.S. inflation data (CPI and PPI) for clues regarding the next moves from the Federal Reserve. Any signs of slowing growth could increase expectations for future rate cuts and support risk assets.
Second, the technology sector may remain under scrutiny following Broadcom’s disappointing outlook. Investors will look for confirmation that AI spending remains strong across the broader semiconductor industry before pushing the Nasdaq to new highs again.
Third, geopolitical developments involving Iran will continue to influence oil, gold, and overall market sentiment. Any signs of de-escalation could pressure safe-haven assets while supporting equities, whereas renewed tensions may trigger another round of volatility.
For cryptocurrencies, Bitcoin’s ability to reclaim and hold above the $62,000 level will be critical. Failure to do so could lead to further liquidations, while stabilization in ETF flows may help restore confidence and attract buyers back into the market.
Major Economic Calendar Events for the Upcoming Week
| Date | Metric | Country | Previous | Time [Dubai] |
| Monday, 8 June | Final GDP q/q | Japan | 0.50% | 3:50 AM |
| Tuesday, 9 June | Existing Home Sales | USA | 4.02M | 6:00 PM |
| Wednesday, 10 June | Consumer Price Index | USA | 3.80% | 4:30 PM |
| Wednesday, 10 June | Interest Rate Decision | Canada | 2.25% | 5:45 PM |
| Thursday, 11 June | Interest Rate Decision | Euro | 2.15% | 4:15 PM |
| Thursday, 11 June | Producer Price Index | USA | 6.00% | 4:30 PM |
| Friday, 12 June | Gross Domestic Product m/m | UK | 0.30% | 10:00 AM |
Technical Analysis and Forecast:
Gold Technical Analysis
Gold continues to exhibit a bearish medium-term structure. The recent trading activity around $4,450–$4,500 suggests a period of consolidation is expected.
The moving averages continue to favor the bears. Price remains below the 20-day moving average at approximately $4,544, while the 5-day and 10-day moving averages are also trending lower. Although there have been several attempts to rally, each rebound has stalled below key resistance levels, reinforcing the prevailing bearish structure.
From a price action perspective, the region between $4,430 and $4,450 has acted as support during recent sessions, preventing a deeper decline. However, buyers have not yet demonstrated sufficient strength to challenge the major resistance zone around $4,550–$4,620.
A break above that area would be needed to signal a potential trend reversal. Conversely, a close below $4,430 could trigger another wave of selling toward $4,300 and potentially the major low at $4,099. For now, the daily outlook remains bearish, with the recent sideways movement appearing more consistent with consolidation within a broader downtrend.
Gold Daily Chart

| Resistance | $4,484 – $4,500 | $4,540 – $4,550 | $4,585 – $4,560 |
| Support | $4,420 – $4,435 | $4,390 – $4,405 | $4,350 – $4,363 |
Brent Technical Analysis
Brent crude oil remains under pressure on the daily timeframe despite recent attempts to stabilize. The recent decline toward the mid-90s reflects concerns about demand growth and the easing of some geopolitical supply fears that previously supported prices.
The moving average structure remains bearish. The 20-day moving average is positioned well above current prices, while the 5-day and 10-day moving averages continue to trend lower. Although price has recently attempted to recover from the lows, these rallies have been shallow and have repeatedly encountered selling pressure. This suggests that the broader trend remains negative despite short-term rebounds.
The area around $95–$97 has become an important support zone, where buyers have recently emerged. However, for the technical outlook to improve, Brent would need to break above the $100–$102 resistance region and reclaim the declining moving averages. Until that occurs, rallies are likely to face selling pressure. A sustained break below the recent lows could expose the $92 region and potentially the major support area near $88. Overall, Brent remains in a corrective downtrend on the daily timeframe, although the pace of the decline has slowed in recent sessions.
Brent Daily Chart

| Resistance | $101.00 – $101.30 | $103.60 – $103.75 | $105.00 – $105.20 |
| Support | $96.58 – $96.70 | $95.00 – $95.20 | $88.20 – $88.35 |
EURUSD Technical Analysis
EURUSD remains in a consolidation phase after failing to sustain the strong bullish momentum that carried the pair to a peak of 1.184 in April. Following that rally, the pair entered a corrective period characterized by lower highs and a gradual decline toward the 1.1600 area.
From a moving average perspective, the pair is trading near both the 5-day and 10-day moving averages, while remaining slightly below the 20-day moving average. The recent sideways movement suggests that the market is waiting for a catalyst before establishing a clearer directional trend.
Price action indicates that the 1.1600–1.1630 region has become an important support zone. Buyers have repeatedly defended this area over the past several sessions, preventing a deeper decline. A break above the 20-day moving average and the 1.1680–1.1700 resistance region would improve the outlook considerably and could trigger a recovery toward 1.1760 and eventually the April high at 1.1848.
On the downside, a close below 1.1600 would expose 1.1550 and potentially the March lows. Overall, the daily structure remains broadly constructive, but EURUSD needs to reclaim higher resistance levels to re-establish bullish momentum.
EURUSD Daily Chart
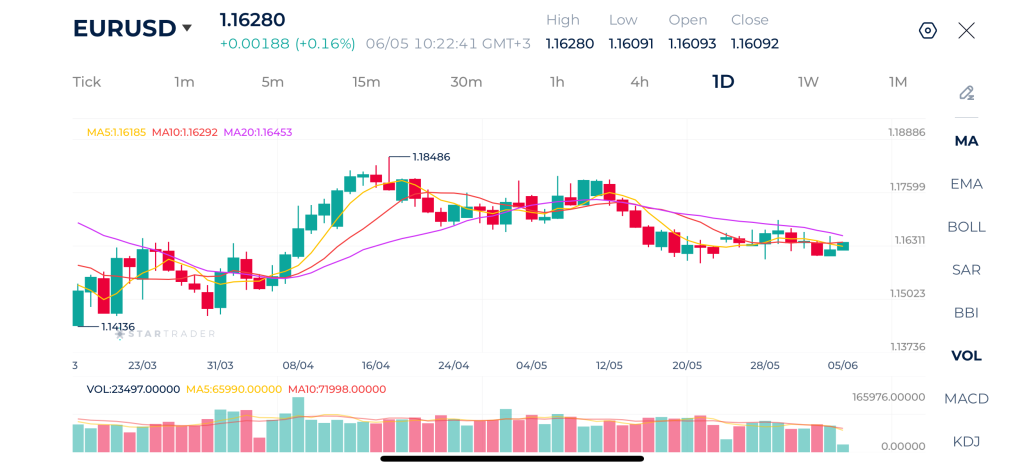
| Resistance | 1.1686 – 1.1700 | 1.1788 – 1.1800 | 1.1840 – 1.1850 |
| Support | 1.1565 – 1.1576 | 1.1483 – 1.1500 | 1.1408 – 1.1420 |
Dow Jones Technical Analysis
The Dow Jones continues to be one of the strongest major equity indices, maintaining a well-defined bullish trend and trading near record highs. The recent advance toward 51,747 confirms that buyers remain firmly in control.
The moving averages support the bullish outlook. The 5-day moving average remains above the 10-day moving average, while both are comfortably above the rising 20-day moving average. This alignment typically reflects a healthy and sustainable uptrend. Furthermore, price continues to trade above all major moving averages, indicating that market sentiment remains positive despite occasional periods of consolidation.
Initial support is located near 51,300, followed by the 50,800–50,500 area where the moving averages converge. As long as these levels hold, the bullish trend remains intact. A break above 51,750 could open the door toward the next psychological milestone around 52,000 and beyond.
Dow Jones Daily Chart

| Resistance | 51,800 – 51,820 | 52,000 52,060 | 52,200 – 52,210 |
| Support | 51,030 – 51,047 | 50,320 – 50,355 | 49,498 – 49,510 |
Risk Disclaimer: This material is provided for informational purposes only and does not constitute a recommendation or investment advice. Trading financial instruments on margin involves substantial risk and may not be appropriate for all investors.
Tags
Open Live Account
Please enter a valid country
No results found
No results found
Please enter a valid email
Please enter a valid verification code
1. 8-16 characters + numbers (0-9) 2. blend of letters (A-Z, a-z) 3. special characters (e.g, !a#S%^&)
Please enter the correct format
Please tick the checkbox to proceed
Please tick the checkbox to proceed
Important Notice
STARTRADER does not accept any applications from Australian residents.
To comply with regulatory requirements, clicking the button will redirect you to the STARTRADER website operated by STARTRADER PRIME GLOBAL PTY LTD (ABN 65 156 005 668), an authorized Australian Financial Services Licence holder (AFSL no. 421210) regulated by the Australian Securities and Investments Commission.
CONTINUEImportant Notice for Residents of the United Arab Emirates
In alignment with local regulatory requirements, individuals residing in the United Arab Emirates are requested to proceed via our dedicated regional platform at startrader.ae, which is operated by STARTRADER Global Financial Consultation & Financial Analysis L.L.C.. This entity is licensed by the UAE Capital Market Authority (CMA) under License No. 20200000241, and is authorised to introduce financial services and promote financial products in the UAE.
Please click the "Continue" button below to be redirected.
CONTINUEError! Please try again.

