








 Web Trader MT5









Key Takeaways
- U.S. stocks extended their record-breaking rally, with the Dow Jones surpassing 53,000 for the first time.
- Gold and silver surged after a weaker-than-expected U.S. jobs report, as June Non-Farm Payrolls came in at just 57,000.
- Oil prices remained under pressure, falling to around $70.20 per barrel during the week before recovering slightly.
- USDJPY climbed to levels not seen in four decades, reflecting the widening policy divergence between the Federal Reserve and the Bank of Japan.
- Investor sentiment remained broadly positive, driven by resilient corporate earnings expectations, and continued strength in the U.S. economy.
U.S. Equity Markets Extend Record-Breaking Rally
U.S. equities delivered another impressive week of gains, with all three major indices finishing higher and both the Dow Jones and the S&P 500 reaching fresh all-time highs. Investor sentiment remained supported by resilient corporate earnings expectations, easing concerns over an imminent Federal Reserve rate hike following weaker-than-expected employment data, and continued optimism surrounding the U.S. economic outlook.
The Dow Jones Industrial Average led the market once again, opening the week at 51,800 before climbing to a record high of 53,063. The index closed the week around 52,926, posting a gain of approximately 2.17%. The continued outperformance of the Dow reflects strong buying interest in industrial, financial, and value-oriented stocks, which have benefited from improving economic sentiment and expectations of stable monetary policy.
The S&P 500 also continued its record-breaking run. After opening the week at 7,341, the benchmark index rallied to an all-time high of 7,541 before ending the week around 7,499. This represents a weekly gain of roughly 2.15%, highlighting the broad-based strength across multiple sectors, including financials, industrials, healthcare, and technology.
Meanwhile, the Nasdaq 100 maintained its upward momentum despite some profit-taking toward the end of the week. The technology-heavy index opened at 29,021, surged to a new record high of 30,325. Although semiconductor and AI-related stocks experienced some volatility, continued investor enthusiasm for artificial intelligence and large-cap technology companies helped keep the Nasdaq near historic highs.
Gold and Silver Rally After Weak U.S. Jobs Report
Precious metals traded quietly during the first half of the week as investors awaited the June U.S. employment report. That changed dramatically on Thursday after the Non-Farm Payrolls (NFP) report showed the U.S. economy created only 57,000 jobs, well below expectations of roughly 110,000–115,000, while the unemployment rate unexpectedly fell to 4.2%, largely because labor-force participation declined.
The weaker employment data reduced expectations that the Federal Reserve would need to raise interest rates again in the near term. Treasury yields declined immediately after the release, weakening the U.S. dollar and providing strong support for precious metals.
Gold responded with a sharp rally, breaking out of its narrow trading range, while silver outperformed thanks to its higher sensitivity to changes in interest-rate expectations and improving industrial demand sentiment.
Oil Suffers Another Weekly Decline
Oil prices remained under pressure for most of the week, with brent crude falling toward $70.20 per barrel before recovering modestly into the weekend.
The decline reflected improving confidence that the recent U.S.–Iran peace agreement will keep supply disruptions limited, together with easing geopolitical risk premiums that had previously supported energy prices. In addition, investors remained concerned that slower global economic growth could soften fuel demand during the second half of the year.
Although prices bounced from weekly lows, oil continues trading well below the highs reached during the Middle East conflict in June.
USDJPY Continues Historic Rally
USDJPY extended its long-term uptrend and continued trading at levels not seen in approximately 40 years, highlighting the widening monetary policy divergence between the Federal Reserve and the Bank of Japan.
The pair experienced increased volatility during the week after traders suspected another round of unofficial intervention by Japanese authorities. Sharp intraday declines were followed by rapid recoveries, a pattern that has become increasingly common whenever the exchange rate approaches new multi-decade highs. Despite these interventions, the broader trend remains bullish as long as U.S. interest rates stay significantly above Japanese rates.
Outlook for the Week Ahead (6 – 10 July 2026)
Markets are expected to remain focused on whether the softer employment report represents the beginning of a broader slowdown in the U.S. economy or merely temporary weakness.
The release of the Federal Open Market Committee meeting minutes will likely be the week’s most important event. Investors will look for additional insight into policymakers’ discussions surrounding inflation risks and the possibility of future rate hikes after June’s hawkish hold.
Any indication that officials remain concerned about persistent inflation could support the U.S. dollar while limiting gains in gold and equities.
Additionally, gold’s ability to hold Thursday’s breakout will be closely monitored. Continued weakness in economic data or a more dovish interpretation of the Fed minutes could allow the metal to extend its recovery.
Conversely, if Fed officials sound more hawkish than markets expect, some of this week’s gains could be retraced.
Oil traders will continue monitoring developments surrounding Middle East supply, OPEC+ production expectations, and global demand forecasts. While prices have stabilized near $70, further downside cannot be ruled out if demand concerns continue to outweigh geopolitical risks.
Major Economic Calendar Events for the Upcoming Week
| Date | Metric | Country | Previous | Time [Dubai] |
| Monday, 6 July | ISM Services PMI | USA | 54.5 | 6:00 PM |
| Tuesday, 7 July | Ivey PMI | Canada | 6:00 PM | |
| Wednesday, 8 July | Interest Rate Decision | New Zealand | 2.25% | 6:00 AM |
| Wednesday, 8 July | FOMC Meeting Minutes | USA | 10:00 PM | |
| Thursday, 9 July | Unemployment Claims | USA | 4:30 PM | |
| Friday, 10 July | Unemployment Rate | Canada | 6.60% | 4:30 PM |
Technical Analysis and Forecast:
Gold Technical Analysis
Gold is showing signs of a strong bullish recovery after rebounding sharply from the $3,942 support area. Price has reclaimed both the 5-day and 10-day moving averages and is now testing the declining 20-day moving average around $4,156, which represents the next major technical hurdle.
The sharp rally from $3,942 has produced higher highs and higher lows, confirming a short-term trend reversal. The strong bullish candle toward $4,195 demonstrates renewed buying interest and suggests investors are returning to safe-haven assets.
The short-term outlook has turned bullish following the strong rebound from $3,942. A sustained move above $4,195 would strengthen the recovery and target the $4,280 resistance zone. If buyers also overcome the 20-day moving average, the rally could extend toward $4,400. On the downside, holding above $4,120–$4,050 remains critical to preserving the current bullish momentum.
Gold Daily Chart
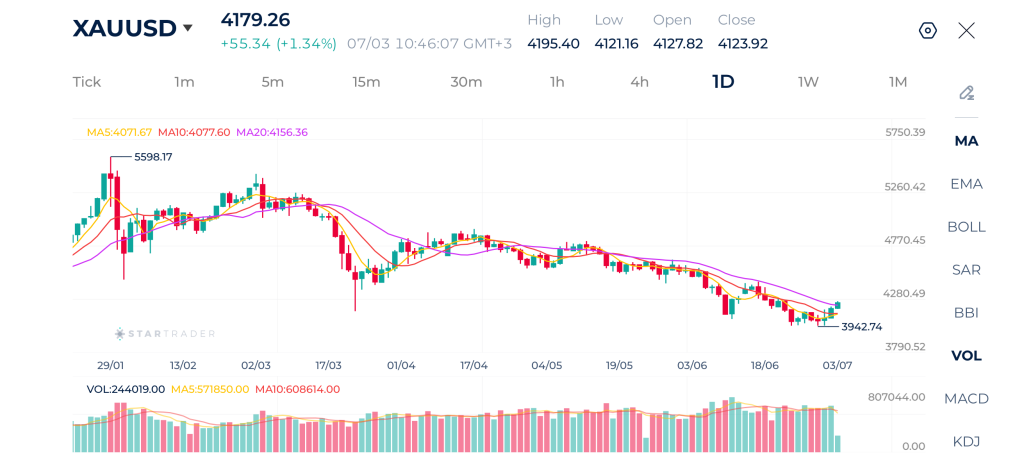
| Resistance | $4,220 – $4,245 | $4,331 – $4,350 | $4,434 – $4,50 |
| Support | $4,088 – $4,100 | $3,945 – $3,965 | $3,899 – $3,915 |
Brent Technical Analysis
Brent crude remains in a clear long-term downtrend. Price continues trading well below the declining 20-day moving average, while the 5-day and 10-day moving averages remain below the 20-day MA, confirming sustained bearish momentum.
The overall outlook remains bearish while Brent trades below $74.40 and particularly below the declining 20-day moving average. A recovery above $74.40 would improve the short-term outlook, but only a sustained move above $80.30 would signal a meaningful trend reversal. Failure to hold above $71.20 would expose $70.00 and potentially lower levels.
Brent Daily Chart
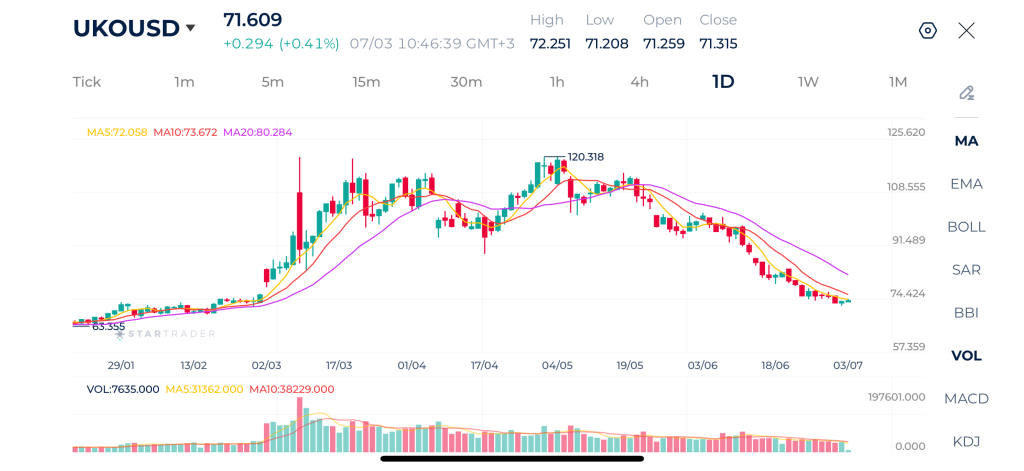
| Resistance | $73.40 – $73.50 | $74.40 – $74.50 | $76.56 – $76.70 |
| Support | $70.10 – $70.25 | $69.20 – $69.30 | $68.44 – $68.60 |
Nasdaq 100 Technical Analysis
The Nasdaq 100 remains in a strong long-term uptrend despite the recent consolidation below the 30,800 peak. Price continues trading above the rising 20-day moving average, confirming that the broader bullish trend remains intact.
However, the moving averages have begun flattening, reflecting slowing upside momentum and increasing consolidation.
The long-term outlook remains bullish while the index holds above 29,200. A decisive break above 30,000–30,800 would confirm the continuation of the primary uptrend and could trigger another bullish leg higher. Conversely, a sustained move below 29,200 would increase the probability of a deeper corrective phase toward 28,500.
Nasdaq 100 Daily Chart
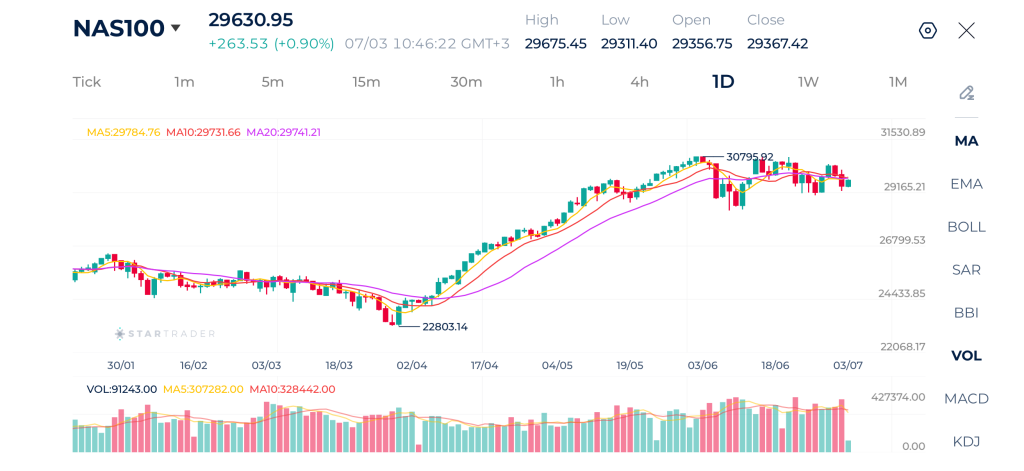
| Resistance | 30,332 – 30,347 | 30,652 – 30,670 | 30,785 – 30,797 |
| Support | 29,100 – 29,120 | 28,882 – 28,900 | 28,194 – 28,210 |
USDJPY Technical Analysis
USD/JPY remains in a strong medium-term uptrend despite the latest pullback from the 162.83 high. The broader trend continues to favor buyers, as price remains above the rising 20-day moving average, which has acted as dynamic support throughout the advance from the May lows.
However, the latest bearish daily candle suggests profit-taking has emerged after the pair became short-term overextended.
The pair has maintained a sequence of higher highs and higher lows since early May, confirming a well-established bullish structure. After reaching 162.83, sellers stepped in aggressively, pushing price back toward the 10-day moving average. Although this signals weakening short-term momentum, the broader trend remains intact as long as price holds above the 20-day MA.
The medium-term outlook remains bullish while USD/JPY holds above 160.00–160.60. A successful defense of this support zone could lead to another attempt at 162.83 and potentially fresh highs. However, a decisive break below 160.00 would likely trigger a deeper correction toward 159.20 and the rising 20-day moving average.
USDJPY Daily Chart
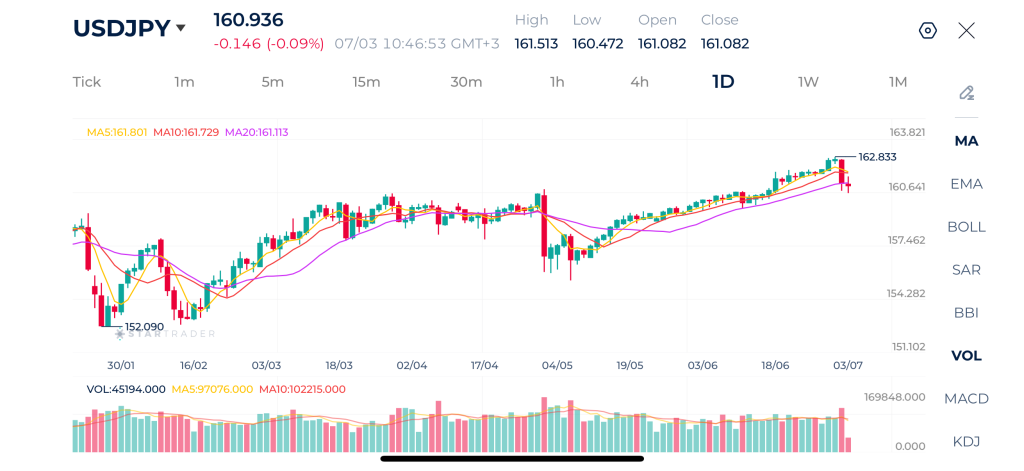
| Resistance | 161.56 – 161.80 | 162.56 – 162.70 | 163.00 – 163.10 |
| Support | 160.36 – 160.50 | 159.52 – 159.70 | 158.74 – 158.85 |
Risk Disclaimer: This material is provided for informational purposes only and does not constitute a recommendation or investment advice. Trading financial instruments on margin involves substantial risk and may not be appropriate for all investors.
Tags


Open Live Account
 Email Address
 Phone Number
Important Notice
STARTRADER does not accept any applications from Australian residents.
To comply with regulatory requirements, clicking the button will redirect you to the STARTRADER website operated by STARTRADER PRIME GLOBAL PTY LTD (ABN 65 156 005 668), an authorized Australian Financial Services Licence holder (AFSL no. 421210) regulated by the Australian Securities and Investments Commission.
Important Notice for Residents of the United Arab Emirates
In alignment with local regulatory requirements, individuals residing in the United Arab Emirates are requested to proceed via our dedicated regional platform at startrader.ae, which is operated by STARTRADER Global Financial Consultation & Financial Analysis L.L.C.. This entity is licensed by the UAE Capital Market Authority (CMA) under License No. 20200000241, and is authorised to introduce financial services and promote financial products in the UAE.
Please click the "Continue" button below to be redirected.


