


Key Takeaways
- High U.S. CPI and PPI data boosted expectations of another Fed rate hike and pressured risk assets.
- U.S. stocks initially sold off on inflation and rate concerns before rebounding after Trump signaled progress toward a deal with Iran.
- Rising Middle East tensions pushed oil prices higher, keeping inflation risks elevated globally.
- Gold fell to multi-month lows as higher inflation and rate hike expectations increased Treasury yields.
- The ECB raised interest rates, supporting the euro but adding pressure on European equity markets.
- Technology and AI-related stocks remained volatile as investors questioned whether current valuations are sustainable.
- The upcoming FOMC meeting is expected to be the most important market catalyst for stocks, gold, currencies, and cryptocurrencies next week.
US Inflation at Highest Level in 3 Years
The Consumer Price Index (CPI) in the US accelerated to 4.2% year-over-year, marking its highest level in three years, while Producer Price Index (PPI) data also showed persistent inflationary pressures throughout the economy. Higher energy prices, driven by tensions in the Middle East and disruptions around the Strait of Hormuz, played a significant role in pushing inflation higher.
As a result, investors significantly increased expectations that the Federal Reserve may need to keep interest rates elevated for longer and potentially deliver another rate hike before the end of the year. Market pricing now implies a growing probability of additional tightening, a sharp shift from expectations earlier this year that focused on rate cuts.
These developments put substantial pressure on gold prices, which fell below major support levels of $4,100 and reached their lowest levels since late 2025. Higher interest rate expectations increase the opportunity cost of holding non-yielding assets such as gold, leading investors to rotate into fixed-income assets offering higher yields.
U.S. Stocks Recovered From the Recent Selloff
Equity markets experienced a dramatic reversal during the week. The initial selloff was triggered by last week’s stronger-than-expected Nonfarm Payrolls report, which reinforced the view that the U.S. economy remains resilient despite higher interest rates. While strong employment data is generally positive for the economy, investors interpreted the report as reducing the likelihood of Federal Reserve rate cuts.
Technology stocks, particularly semiconductor and AI-related companies, came under pressure as higher interest rates threaten future growth valuations. The Dow Jones suffered one of its largest declines of the year, falling nearly 1,000 points during Wednesday’s session, while the Nasdaq and S&P 500 also recorded sharp losses.
However, sentiment improved significantly on Thursday after President Donald Trump announced that planned military actions against Iran had been called off and suggested that negotiations were progressing toward a potential agreement. The announcement reduced fears of a broader regional conflict, helping equities rebound and improving overall market risk sentiment.
Investor rotation continued throughout the week, with money flowing out of technology and into defensive sectors such as healthcare, financials, and energy.
ECB Delivered 25 bps Rate Hike to Curb Inflation
The European Central Bank raised interest rates this week as policymakers continued their fight against persistent inflation across the Eurozone.
The decision initially supported the euro, with EURUSD moving higher as interest rate differentials between Europe and the United States narrowed. However, gains were limited as stronger U.S. inflation data simultaneously boosted expectations for a more hawkish Federal Reserve.
European equities reacted negatively to the ECB’s decision, as higher borrowing costs increase pressure on economic growth and corporate earnings. Interest-rate-sensitive sectors such as real estate and consumer discretionary stocks faced the most pressure.
Looking ahead, the ECB is likely to maintain a data-dependent approach. While inflation remains above target, signs of slowing economic growth may limit the pace of future tightening. Markets will closely monitor incoming inflation and labor market data for clues regarding the ECB’s next move.
Oil Fluctuated, while Gold Remained Under Pressure
Escalating tensions between the United States and Iran pushed Brent crude above $93 per barrel and WTI crude above $90 per barrel as traders worried about potential disruptions to energy supplies passing through the Strait of Hormuz.
Although OPEC+ continues to gradually increase production, geopolitical risks remained the dominant driver of prices throughout the week.
Gold moved in the opposite direction. Despite traditionally benefiting from geopolitical uncertainty, the precious metal struggled as investors focused on rising inflation and higher interest rate expectations. Gold fell below key technical support levels of $4,100 and reached its lowest levels since November 2025.
Major Economic Calendar Events for the Upcoming Week
| Date | Metric | Country | Previous | Time [Dubai] |
| Monday, 15 June | Empire State Manufacturing Index | USA | 19.6 | 4:30 PM |
| Tuesday, 16 June | Interest Rate Decision | Japan | <0.75% | Tentative |
| Tuesday, 16 June | Interest Rate Decision | Australia | 4.35% | 8:30 AM |
| Wednesday, 17 June | Consumer Price Index y/y | UK | 2.80% | 10:00 AM |
| Wednesday, 17 June | Retail Sales m/m | USA | 0.50% | 4:30 PM |
| Wednesday, 17 June | Federal Funds Rate | USA | 3.75% | 10:00 PM |
| Thursday, 18 June | Interest Rate Decision | Switzerland | 0.00% | 11:30 AM |
| Thursday, 18 June | Interest Rate Decision | UK | 3.75% | 3:00 PM |
| Friday, 19 June | Retail Sales | UK | -1.30% | 10:00 AM |
Technical Analysis and Forecast:
Gold Technical Analysis
The near term trend for gold continues to point lower as the precious metal is consistently forming lower highs and lower lows, confirming a well-established bearish trend.
The immediate resistance zone is located around $4,250–$4,300, followed by the 20-day moving average near $4,425. Only a sustained move above this area would improve the medium-term outlook. On the downside, support remains at $4,023. A break below this level would likely trigger another wave of selling toward $3,900 and potentially lower.
The overall technical picture in the short to mid-term remains bearish, and sellers continue to hold the advantage while price remains below the major moving averages.
Gold Daily Chart
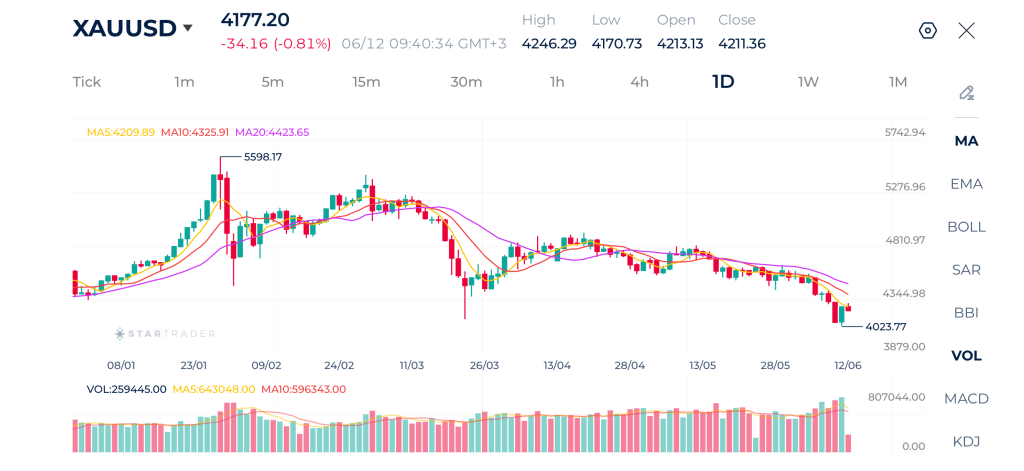
| Resistance | $4,329 – $4,350 | $4,500 – $4,520 | $4,600 – $4,620 |
| Support | $4,025 – $4,060 | $3,888 – $3,920 | $3,760 – $3,800 |
Brent Technical Analysis
Brent crude oil has clearly shifted from a strong bullish trend into a sustained bearish trend over the past several weeks.
The moving averages confirm this weakness. The 5-day moving average remains below the 10-day average, while both are trading below the 20-day moving average. This bearish alignment is typically associated with continuing downside momentum. In addition, price continues to struggle whenever it attempts to recover toward the moving averages.
Support is now located near $89.00, which is an important psychological level. A decisive break below this area would likely open the door toward $87.00 and potentially $85.00. Resistance is found near $92.50–$93.00, followed by $95.00 and then $98.50.
Brent Daily Chart
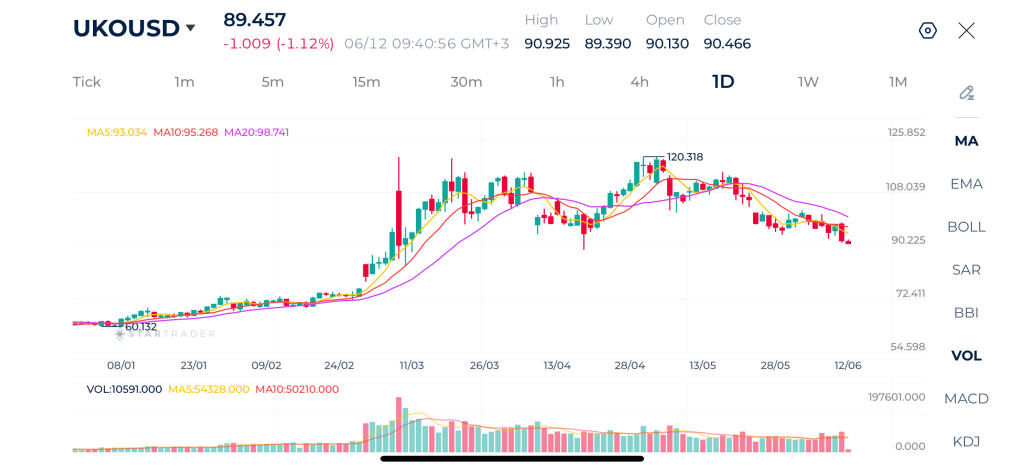
| Resistance | $92.30 – $92.50 | $95.00 – $95.20 | $98.50 – $98.70 |
| Support | $89.00 – $89.20 | $87.00 – $87.15 | $84.80 – $85.00 |
Nasdaq 100 Technical Analysis
NASDAQ remains in a strong long-term uptrend despite the sharp pullback seen over the past several sessions. Since bottoming near 22,800 in March, the index has produced a powerful rally that carried prices to a record high around 30,795. While the recent decline has interrupted bullish momentum, the broader market structure continues to favor buyers as the index remains significantly above the March lows.
Technically, the recent correction pushed price below the 5-day and 10-day moving averages, while the 20-day moving average is flattening after a steep rise. This suggests that upside momentum has slowed considerably and the market is entering a consolidation phase. However, the fact that buyers stepped back in near the 29,000 area indicates that demand remains present on dips.
The key support zone is located around 29,150–29,200, followed by stronger support near 28,500. As long as these levels hold, the broader bullish structure remains intact. On the upside, resistance is seen around 29,700–29,800, followed by the psychological 30,000 level and ultimately the recent peak at 30,795.
Nasdaq 100 Daily Chart
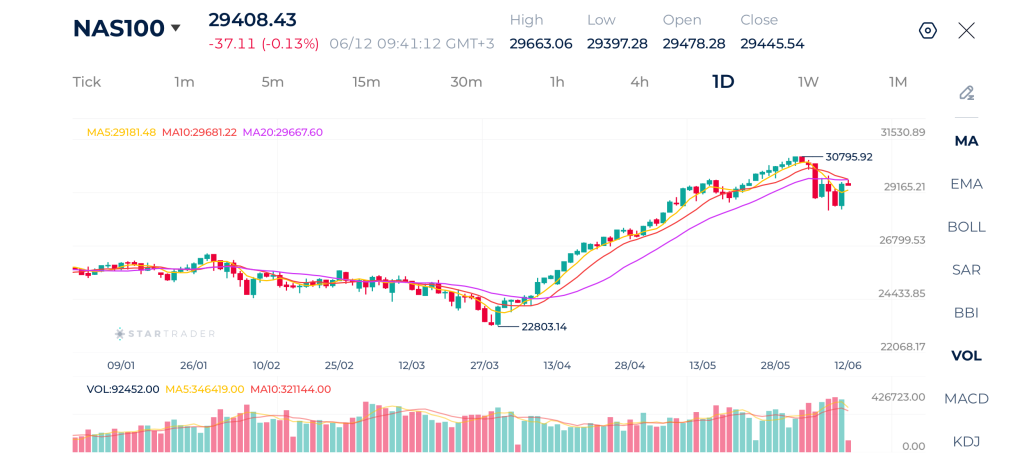
| Resistance | 30,037 – 30,225 | 30,565 – 30,612 | 30,741 – 30,800 |
| Support | 28,209 – 28,400 | 27,614 – 27,720 | 27,295 – 27,330 |
EURUSD Technical Analysis
EURUSD continues to trade within a medium-term corrective phase after failing to sustain its rally above 1.2000 earlier this year. The pair has been forming a sequence of lower highs and lower lows since April, which is characteristic of a bearish trend.
The moving average structure also reflects weakening momentum. Price remains below both the 10-day and 20-day moving averages, while the 20-day average is beginning to slope downward. This indicates that sellers currently maintain control of the market and that bullish attempts remain limited.
The most important support area lies around 1.1540–1.1500. A break below this zone would expose the March low near 1.1410 and could trigger an acceleration of the downtrend. On the upside, resistance is located around 1.1600, followed by 1.1650 and then 1.1750.
EURUSD Daily Chart
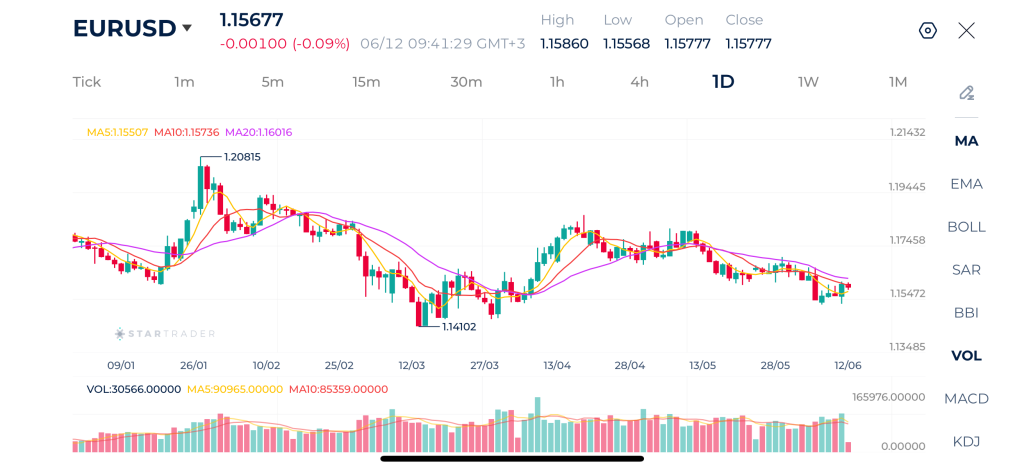
| Resistance | 1.1643 – 1.1660 | 1.1730 – 1.1745 | 1.1788 – 1.1800 |
| Support | 1.1502 – 1.1510 | 1.1430 – 1.1445 | 1.1398 – 1.1400 |
Risk Disclaimer: This material is provided for informational purposes only and does not constitute a recommendation or investment advice. Trading financial instruments on margin involves substantial risk and may not be appropriate for all investors.
Tags
Open Live Account
Please enter a valid country
No results found
No results found
Please enter a valid email
Please enter a valid verification code
1. 8-16 characters + numbers (0-9) 2. blend of letters (A-Z, a-z) 3. special characters (e.g, !a#S%^&)
Please enter the correct format
Please tick the checkbox to proceed
Please tick the checkbox to proceed
Important Notice
STARTRADER does not accept any applications from Australian residents.
To comply with regulatory requirements, clicking the button will redirect you to the STARTRADER website operated by STARTRADER PRIME GLOBAL PTY LTD (ABN 65 156 005 668), an authorized Australian Financial Services Licence holder (AFSL no. 421210) regulated by the Australian Securities and Investments Commission.
CONTINUEImportant Notice for Residents of the United Arab Emirates
In alignment with local regulatory requirements, individuals residing in the United Arab Emirates are requested to proceed via our dedicated regional platform at startrader.ae, which is operated by STARTRADER Global Financial Consultation & Financial Analysis L.L.C.. This entity is licensed by the UAE Capital Market Authority (CMA) under License No. 20200000241, and is authorised to introduce financial services and promote financial products in the UAE.
Please click the "Continue" button below to be redirected.
CONTINUEError! Please try again.

