








 Web Trader MT5











Key Takeaways
- The S&P 500 and Nasdaq reached fresh all-time highs as AI-driven technology stocks continued leading the rally.
- The Dow Jones Industrial Average climbed back above the historic 50,000 level, supported by resilient earnings and strong economic data.
- U.S. CPI and PPI inflation data both came in hotter than expected, reinforcing expectations that the Federal Reserve may keep interest rates elevated for longer.
- Kevin Warsh was officially confirmed as the next Fed Chair, increasing market focus on the future direction of U.S. monetary policy.
- The summit between Donald Trump and Xi Jinping in Beijing became the center of global attention, with investors watching for progress on trade, tariffs, and geopolitical stability.
- Oil prices remained highly volatile as uncertainty around the U.S.-Iran conflict and the Strait of Hormuz continued to dominate energy markets.
- Bitcoin climbed back above the $80,000 level as institutional demand and ETF inflows improved risk appetite across crypto markets.
U.S. Markets at Record Highs Despite a Rise in Inflation Prints
U.S. equities extended their rally this week, with the S&P 500 and Nasdaq reaching new record highs, driven primarily by semiconductor and AI-related stocks. Companies such as Nvidia, Micron Technology, and Cisco Systems helped fuel bullish momentum as investors continued rotating into AI infrastructure and technology plays.
Nasdaq 100 reached a new record high of 29,676 on Thursday, while the S&P 500 broke above 7,500 for the first time. The Dow Jones also reclaimed the 50,000 level for the first time in months, reflecting broader confidence in the resilience of the U.S. economy.
However, inflation remained the major macroeconomic story of the week. U.S. CPI rose 3.8% year-over-year in April, while PPI surged 6%, its fastest annual increase in four years. Rising oil and energy prices linked to Middle East tensions were major contributors to the inflation spike. The stronger inflation data reinforced expectations that the Federal Reserve may delay rate cuts and potentially maintain restrictive policy for longer under incoming Fed Chair Kevin Warsh.
Despite the inflation concerns, investors largely interpreted the data as evidence that economic activity remains strong rather than signaling an imminent slowdown.
Asian Markets Continue to Advance Higher
Asian markets delivered another strong performance this week. Japan’s Nikkei 225 rose to new record highs above 63,800, while South Korea’s Kospi continued its historic rally, surpassing 8,000 for the first time.
Shares of Samsung Electronics surged to fresh record highs again as enthusiasm around semiconductors and AI demand continued accelerating. Markets closely followed the summit between Trump and Xi Jinping in Beijing. Investors focused on discussions surrounding tariffs, technology restrictions, semiconductor trade, and global supply chains. Although no major breakthrough was announced , the willingness of both sides to continue negotiations helped stabilize investor sentiment globally.
The US Dollar Index Jumps 1.2% on Rate Hike Expectations
The U.S. dollar strengthened during most of the week following the hotter-than-expected inflation reports and rising Treasury yields. Higher inflation reduced expectations for near-term Fed rate cuts, supporting the dollar particularly against low-yielding currencies such as the Japanese yen and euro.
The Dollar Index rose 1.2% during the week to 99.23. And the Japanese yen remained under pressure as rising U.S. yields widened interest rate differentials, while the euro traded cautiously amid weaker European growth expectations and political uncertainty in the U.K. and Europe.
Commodity-linked currencies such as the Canadian dollar and Australian dollar remained highly sensitive to oil and commodity price movements throughout the week.
Gold Falls Sharply to the $4,500s on a Stronger Dollar
Gold experienced highly volatile trading conditions this week. The precious metal initially climbed above $4,700 amid geopolitical uncertainty and safe-haven demand, but gains became limited after stronger inflation data boosted the U.S. dollar and Treasury yields.
Markets remain torn between two competing forces, geopolitical uncertainty supporting safe-haven demand, and higher interest rate expectations weighing on non-yielding assets like gold.
Oil prices stayed elevated throughout the week as investors continued monitoring developments surrounding Iran, the Strait of Hormuz, and global energy supply disruptions. Brent Crude remained above $100 per barrel during parts of the week, while supply concerns continued fueling inflation expectations globally.
Industrial metals also remained strong, with copper prices surging toward record highs due to tight supply conditions and growing AI-related infrastructure demand.
Major Economic Calendar Events for the Upcoming Week
| Date | Metric | Country | Previous | Time [Dubai] |
| Monday, 18 May | EU Economic Forecasts | Euro | 1:00 PM | |
| Tuesday, 19 May | Claimant Count Change | UK | 26.8K | 10:00 AM |
| Tuesday, 19 May | Consumer Price Index y/y | Canada | 2.60% | 4:30 PM |
| Tuesday, 19 May | Pending Home Sales m/m | USA | 1.50% | 6:00 PM |
| Wednesday, 20 May | Consumer Price Index y/y | UK | 3.30% | 10:00 AM |
| Wednesday, 20 May | FOMC Meeting Minutes | USA | 10:00 PM | |
| Thursday, 21 May | Unemployment Rate | Australia | 4.30% | 5:30 AM |
| Thursday, 21 May | Flash Manufacturing PMI | UK | 53.7 | 12:30 PM |
| Thursday, 21 May | Flash Services PMI | UK | 52.7 | 12:30 PM |
| Thursday, 21 May | Flash Manufacturing PMI | USA | 54.5 | 5:45 PM |
| Thursday, 21 May | Flash Services PMI | USA | 51 | 5:45 PM |
| Friday, 22 May | Retail Sales m/m | UK | 0.70% | 10:00 AM |
| Friday, 22 May | Retail Sales m/m | Canada | 0.70% | 4:30 PM |
Technical Analysis and Forecast:
Brent Technical Analysis
Brent Crude shows a resilient bullish structure, and it’s currently trading at $110.352. The recent price action suggests buyers are stepping in near the local support.
Moving averages MA5 and MA10 are currently converging with the price. While the longer average MA20 is acting as a dynamic support level. As long as the price stays above the MA20, the medium-term bullish structure remains intact.
The trend remains bullish. A sustained break above $112.00 could signal a move back toward the $117.00 mark. A break below the $108.70 support level would suggest a deeper correction toward the $102.00 horizontal support level.
Brent Daily Chart
| Resistance | $110.00 – $110.48 | $112.85 – $113.00 | $117.88 – $118.30 |
| Support | $108.00 – $108.20 | $105.00 – $105.20 | $101.60 – $102.00 |
Gold Technical Analysis
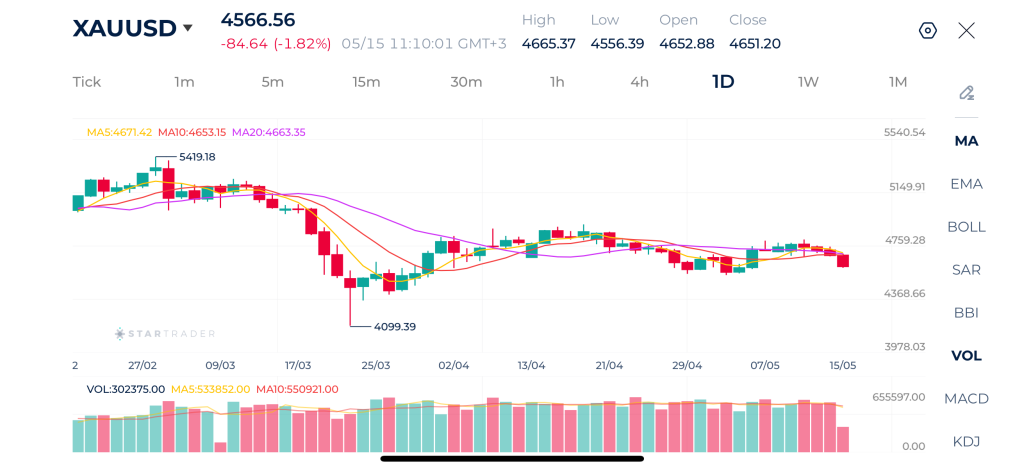
After a period of sharp decline and a subsequent volatile recovery, the price is currently entering a consolidation phase with a bearish bias.
The most recent candle is a notable bearish engulfing or strong red candle, pushing price below the short-term Moving Averages (MAs). This suggests selling pressure is picking up again after a failed attempt to hold the $4,759 level. The MA5 and MA10 are starting to curl downward.
The price is currently trading at $4566, which is below all primary MAs displayed (5, 10, and 20), indicating a short-term bearish regime. Volume has remained relatively consistent, but the recent uptick in red volume bars aligns with the price drop, confirming active distribution.
If the price fails to reclaim the $4,650 level quickly, a retest of the psychological $4,400 zone or the previous low of $4,099 becomes highly probable.
Gold Daily Chart
| Resistance | $4,775 – $4,790 | $4,824 – $4,840 | $4,939 – $4,950 |
| Support | $4,498 – $4,520 | $4,370 – $4,400 | $4,285 – $4,300 |
Dow Jones Technical Analysis
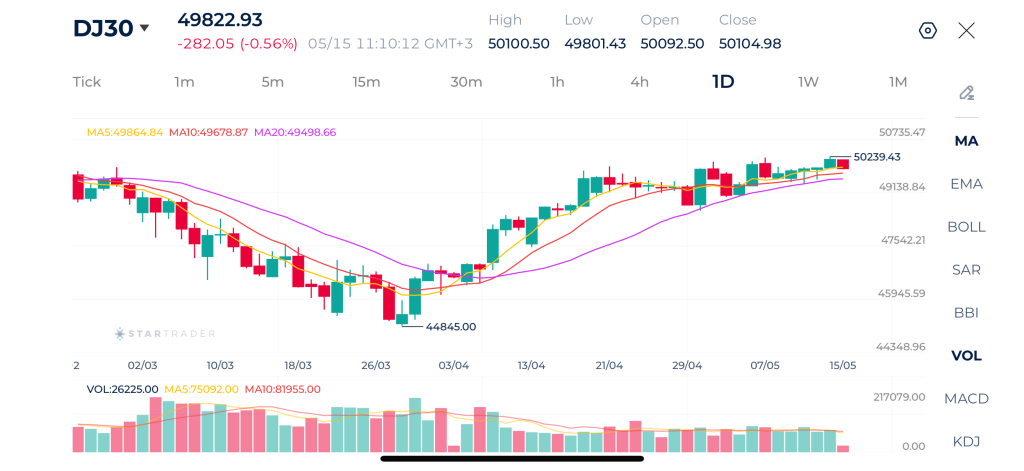
The daily chart on Dow Jones highlights a powerful V-shaped recovery that pushed the index back toward the historic 50,000 region, confirming that buyers remain firmly in control of the broader trend. Price action is currently trading above all key moving averages, indicating that momentum remains positive despite the latest daily pullback.
Technically, the market still favors dip-buying behavior while above the 20-day moving average. The rising MA20 also continues acting as dynamic support, reinforcing the bullish medium-term outlook. On the downside, initial support is located around 49,500, followed by stronger support near 49,100 and then 48,500. A break below those levels would suggest the rally is losing strength and could trigger a deeper correction phase.
Dow Jones Daily Chart
| Resistance | 50,200 – 50,240 | 50,473 – 50,500 | 50,700 – 50,250 |
| Support | 49,321 – 49,500 | 48,898 – 49,000 | 48,489 – 48,600 |
Bitcoin Technical Analysis
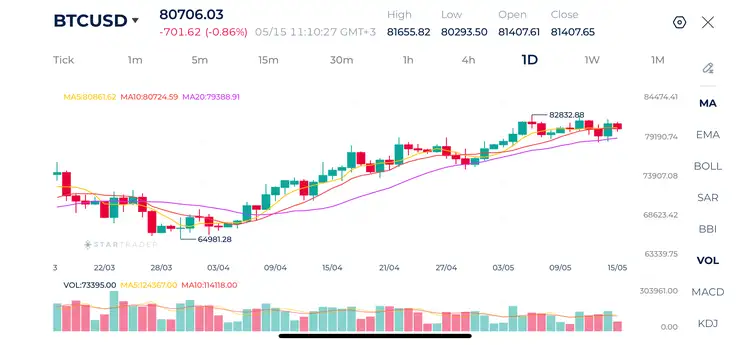
Bitcoin remains in a broader bullish structure on the daily timeframe despite the current pullback. Price action continues to trade above the 20-day moving average and also above the 10-day moving average, showing that the medium-term uptrend is still intact. The fact that Bitcoin is still holding above the psychologically important $80,000 region keeps buyers in control structurally, although momentum has clearly slowed compared to the aggressive upside move seen during April and early May.
The moving averages remain positively aligned, with the MA5 above the MA10 and both above the MA20, which is typically a bullish continuation configuration.
If Bitcoin manages to reclaim and close above the $82,800 resistance area, this could open the door for another impulsive move toward the $84,500–$85,000 zone. On the downside, immediate support stands around $80,000–$80,700, followed by stronger support near the $79,000–$79,400 region. A break below that area would likely trigger a deeper correction toward $77,500 and potentially $75,000.
As long as BTC remains above the 20-day moving average and continues forming higher lows on the daily timeframe, the broader trend bias remains bullish. However, traders should closely monitor the $80,000 level because losing that support decisively could shift short-term sentiment bearish and increase volatility across the crypto market.
Bitcoin Daily Chart
| Resistance | $82,800 – $83,000 | $85,000 – $85,360 | $89,651 – $90,000 |
| Support | $78,800 – $79,000 | $76,243 – $76,450 | $75,000 – $75,230 |
Risk Disclaimer: This material is provided for informational purposes only and does not constitute a recommendation or investment advice. Trading financial instruments on margin involves substantial risk and may not be appropriate for all investors.
Tags


Open Live Account
 Email Address
 Phone Number
Important Notice
STARTRADER does not accept any applications from Australian residents.
To comply with regulatory requirements, clicking the button will redirect you to the STARTRADER website operated by STARTRADER PRIME GLOBAL PTY LTD (ABN 65 156 005 668), an authorized Australian Financial Services Licence holder (AFSL no. 421210) regulated by the Australian Securities and Investments Commission.
Important Notice for Residents of the United Arab Emirates
In alignment with local regulatory requirements, individuals residing in the United Arab Emirates are requested to proceed via our dedicated regional platform at startrader.ae, which is operated by STARTRADER Global Financial Consultation & Financial Analysis L.L.C.. This entity is licensed by the UAE Capital Market Authority (CMA) under License No. 20200000241, and is authorised to introduce financial services and promote financial products in the UAE.
Please click the "Continue" button below to be redirected.


