








 Web Trader MT5









Key Takeaways
- US inflation is cooling as July CPI slowed to 3.4% YoY, while core CPI eased to 2.5%, both broadly in line with expectations.
- September Fed hike expectations fell sharply with markets now pricing roughly a 35% probability.
- US stocks reached fresh highs as lower rate-hike expectations supported risk appetite, with the S&P 500 hitting a new record and technology stocks leading the rally.
- Gold broke above $4,400 thanks to softer inflation and lower Fed hike expectations.
- Middle East tensions kept oil elevated with Brent rising roughly 5% during the week.
- Asian markets staged a powerful rebound with the strongest weekly performance in around two months.
Financial markets had a broadly positive week as softer US inflation data reduced expectations for another Federal Reserve rate hike, supporting equities and gold. At the same time, renewed uncertainty surrounding the US-Iran conflict and the Strait of Hormuz kept oil prices elevated and prevented a more decisive improvement in global risk sentiment. Asian equities were among the strongest performers, extending their rebound from the sharp technology-led selloff seen in late July and early August.
US Inflation Shifts Federal Reserve Expectations
The biggest macroeconomic event of the week was the release of the July US CPI report. Headline inflation slowed to 3.4% year-on-year, from 3.5% in June, matching expectations. Core CPI also came in broadly as expected, rising 2.5% YoY, down from 2.6% previously. While inflation remains above the Fed’s 2% target, the report provided further evidence that price pressures are not accelerating significantly.
And on Thursday, the July PPI report provided an even more dovish signal. Producer prices were unchanged month-on-month, compared with expectations for a 0.2% increase, while annual PPI inflation slowed sharply to 4.7% from 5.5%. The combination of softer consumer and producer inflation, together with last week’s weak employment report, reduced pressure on the Fed to raise rates in September.
As a result, markets significantly reduced expectations for a September rate hike. The probability fell to around 35% by Friday, compared with roughly 55% a week earlier. The market is therefore increasingly looking toward October or December as the more likely window for any additional tightening.
US Stock Markets Rose During the Week
The softer inflation figures provided another boost to US equities. Lower expectations for interest-rate increases reduced pressure on Treasury yields and supported technology and growth stocks. The S&P 500 reached a fresh record close on Thursday, breaking 7,800, while the Nasdaq reached 30,000 again.
The key takeaway for equities was that cooler inflation created a more favorable combination of economic resilience and less aggressive monetary policy. However, the market remains vulnerable to a renewed rise in oil prices because a prolonged energy shock could push inflation higher again and force the Fed to maintain a tighter policy stance.
Gold Rises on Reduced Rate Hike Expectations
Gold was one of the clearest beneficiaries of the softer inflation data. The combination of the weaker July jobs report and cooler-than-expected inflation reduced expectations for a September Fed hike, lowering the opportunity cost of holding the non-yielding precious metal.
Gold initially rallied strongly, breaking above the $4,400 level and reaching approximately $4,450, its highest level since June 5. However, the rally was followed by significant profit-taking, with spot gold falling back toward the $4,350 area.
The outlook remains highly dependent on two opposing forces: lower interest-rate expectations are bullish for gold, while higher oil prices and geopolitical tensions could reignite inflation and support the US dollar and Treasury yields.
Outlook for Next Week
The market enters next week with a more constructive risk backdrop, but several important risks remain. The biggest question is whether the combination of softer inflation and weaker labor-market data will be enough to convince the Fed to remain on hold in September. Current pricing suggests that a September hike is becoming increasingly unlikely, but the Fed still has to contend with inflation remaining above target.
For gold, the $4,400 area will remain an important psychological level. A sustained move back above $4,400 could reopen the path toward the $4,450–$4,500 area, while a failure to regain that level could lead to further profit-taking toward $4,350 and potentially lower.
For oil, developments around the Strait of Hormuz will remain the dominant driver. Any progress toward reopening the Strait could trigger a sharp decline in the geopolitical premium, while further attacks, sanctions or a blockade could push crude significantly higher and revive global inflation fears.
For equities, the outlook remains positive as long as inflation continues to cool and AI-related earnings remain strong. However, after the powerful rebound in Asian technology stocks and the S&P 500 reaching another record, valuations and geopolitical risks could encourage some consolidation.
Overall, next week is likely to be driven by the interaction between three forces: softer US inflation and falling Fed-hike expectations, persistent Middle East energy risks, and continued enthusiasm around AI and semiconductor stocks. The biggest threat to the current risk-on environment would be a renewed surge in oil prices, because it could quickly reverse the improvement in inflation expectations that markets celebrated this week.
Major Economic Calendar Events for the Upcoming Week
| Date | Metric | Country | Previous | Time [Dubai] |
|---|---|---|---|---|
| Monday, 17 August | Gross Domestic Product q/q | Japan | 0.5% | 3:50 AM |
| Monday, 17 August | Median CPI y/y | Canada | 1.9% | 4:30 PM |
| Tuesday, 18 August | Claimant Count Change | UK | 6.7K | 10:00 AM |
| Wednesday, 19 August | Consumer Price Index y/y | UK | 2.6% | 10:00 AM |
| Wednesday, 19 August | Consumer Price Index y/y | Euro | 2.9% | 1:00 PM |
| Wednesday, 19 August | FOMC Meeting Minutes | USA | 10:00 PM | |
| Thursday, 20 August | Unemployment Rate | Australia | 0.044 | 5:30 AM |
| Thursday, 20 August | Unemployment Claims | USA | 4:30 PM | |
| Friday, 21 August | Flash Manufacturing PMI | USA | 53.9 | 5:45 PM |
| Friday, 21 August | Flash Services PMI | USA | 54.6 | 5:45 PM |
Technical Analysis and Forecast:
Brent Technical Analysis
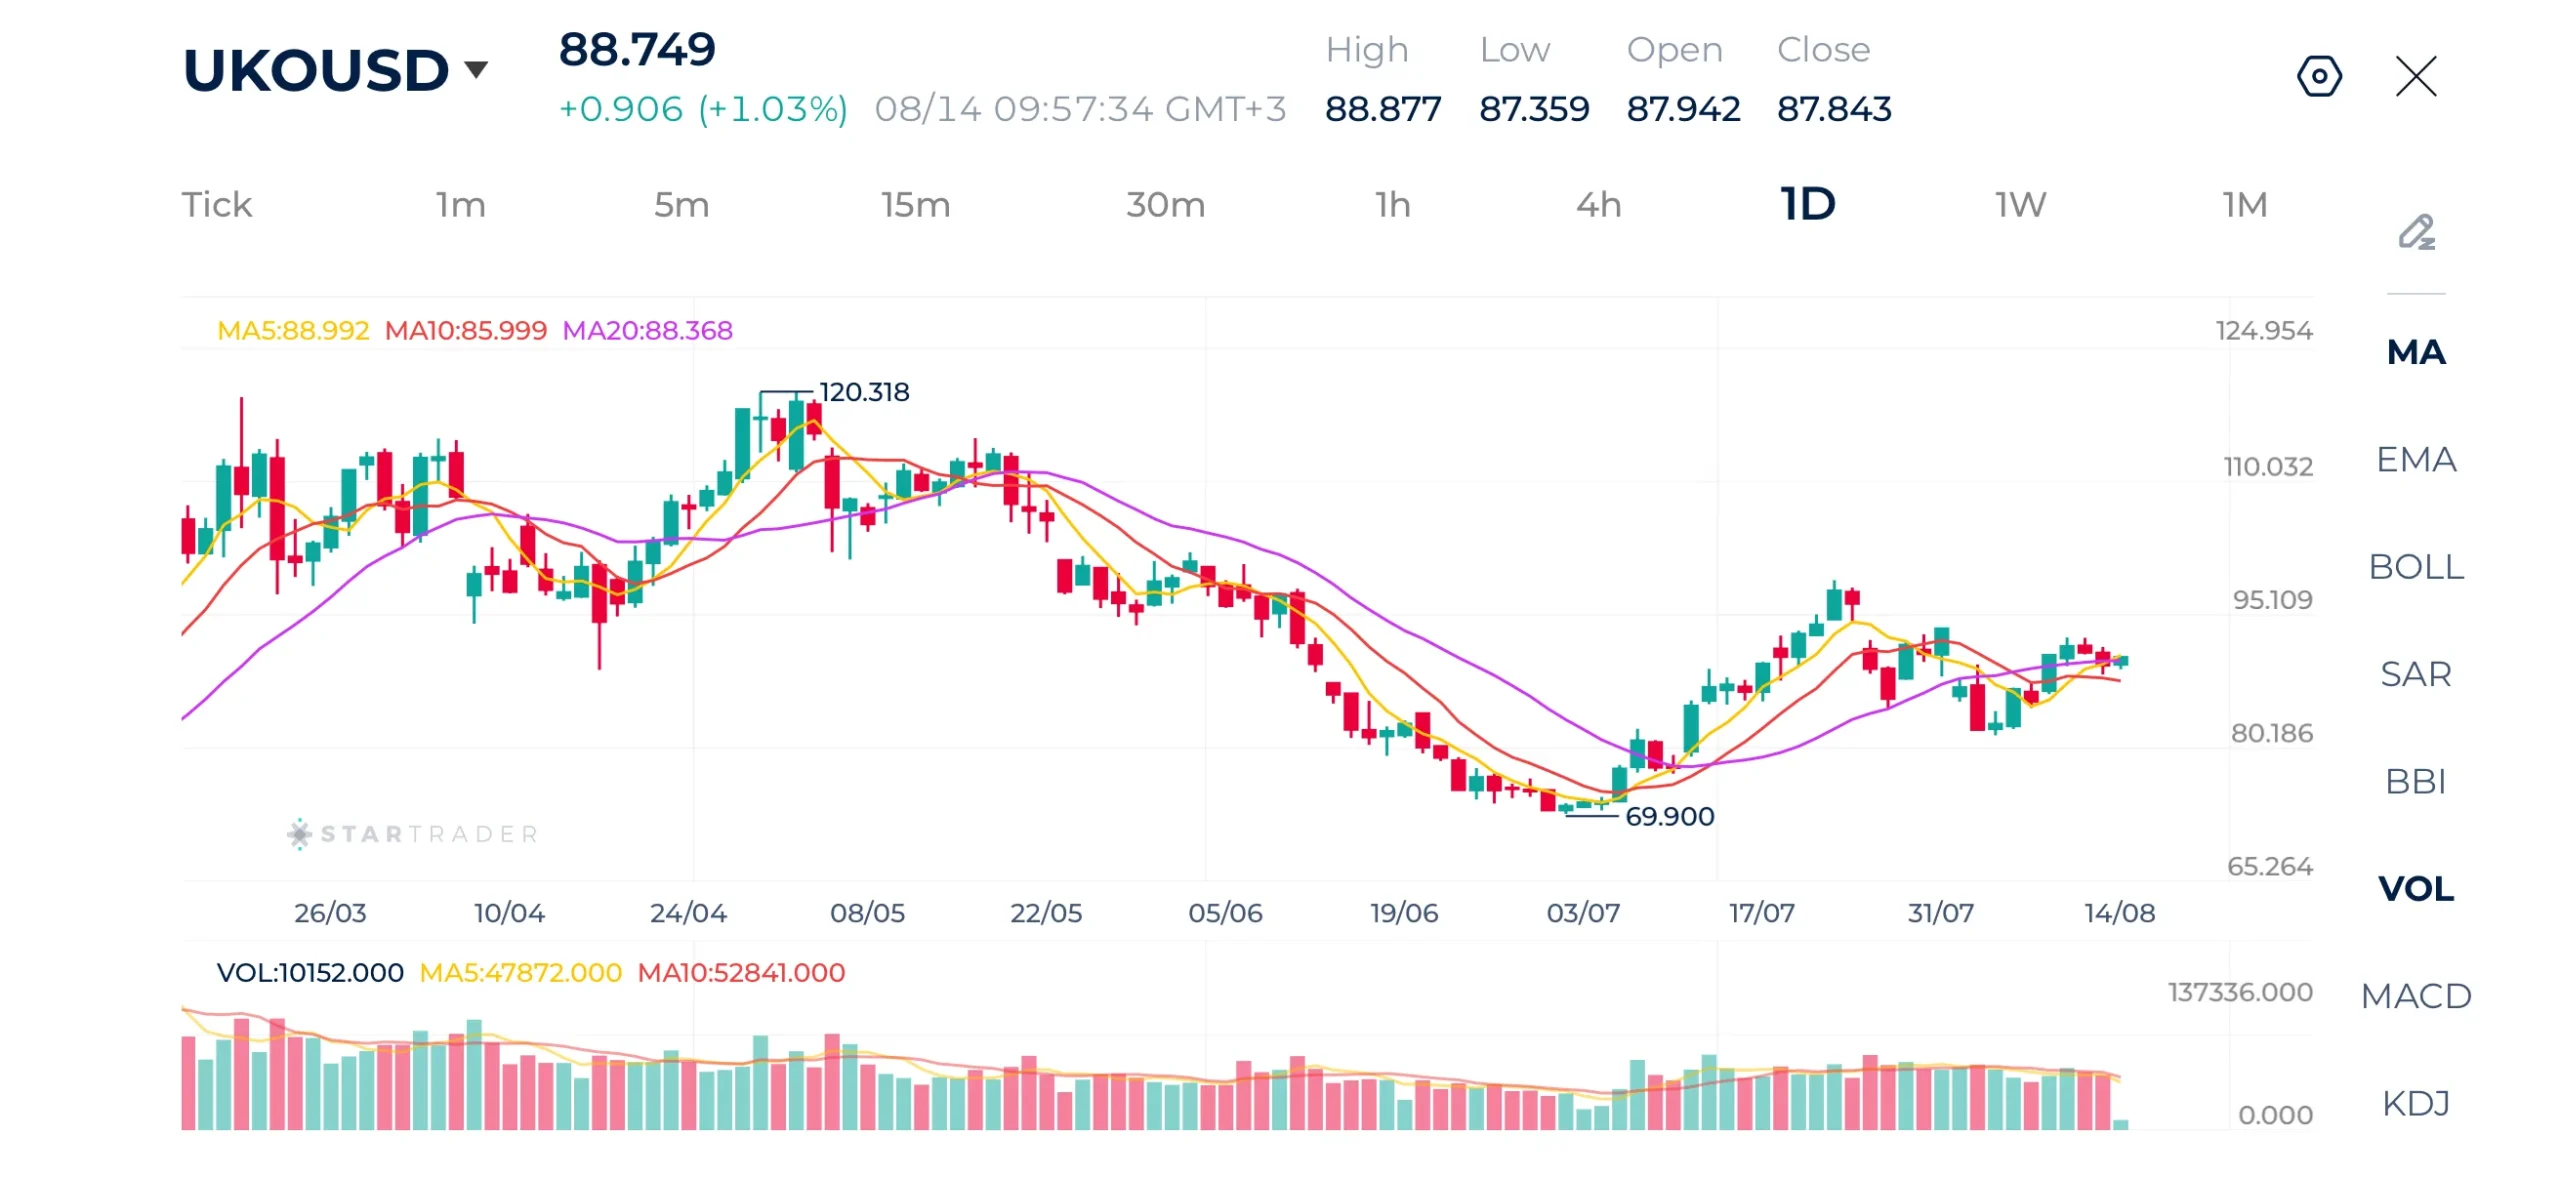
The daily chart for brent shows price action entered a sustained markdown phase, forming lower lows and lower highs down to a major bottom at $69.90 in early July. Following this low, price broke above its declining moving averages, triggering a strong rally into mid-to-late July.
Currently trading around $88.75, crude brent is consolidating near its 5-day and 20-day moving averages, while remaining above the 10-day moving average. The moving averages are beginning to flatten, signaling a pause in momentum after the recent upward push. Immediate support rests around $87.00 near the 10-day MA, with key overhead resistance sitting near the recent local peak around $95.00.
Brent Daily Chart
| Resistance | $92.34 – $92.50 | $95.30 – $95.46 | $97.10 – $97.20 |
|---|---|---|---|
| Support | $82.45 – $82.60 | $79.88 – $80.00 | $77.30 – $77.50 |
EURUSD Technical Analysis
The daily timeframe for EURUSD reflects a prolonged period of tight consolidation along the 1.1300 level, buyers pushed price upward starting late July, creating a clear shift in structure toward higher highs and higher lows.
EURUSD is currently trading at 1.1543, holding firmly above its 20-day moving average. The short-term 5-day and 10-day moving averages are clustered tightly together just below current price levels, providing dynamic near-term support. Price action is currently consolidating sideways after a multi-week run, indicating digestion of recent gains. A break above resistance at 1.1586 would open the path toward 1.1740, while a pull below 1.1530 could test dynamic support around the 20-day MA near 1.1480.
EURUSD Daily Chart
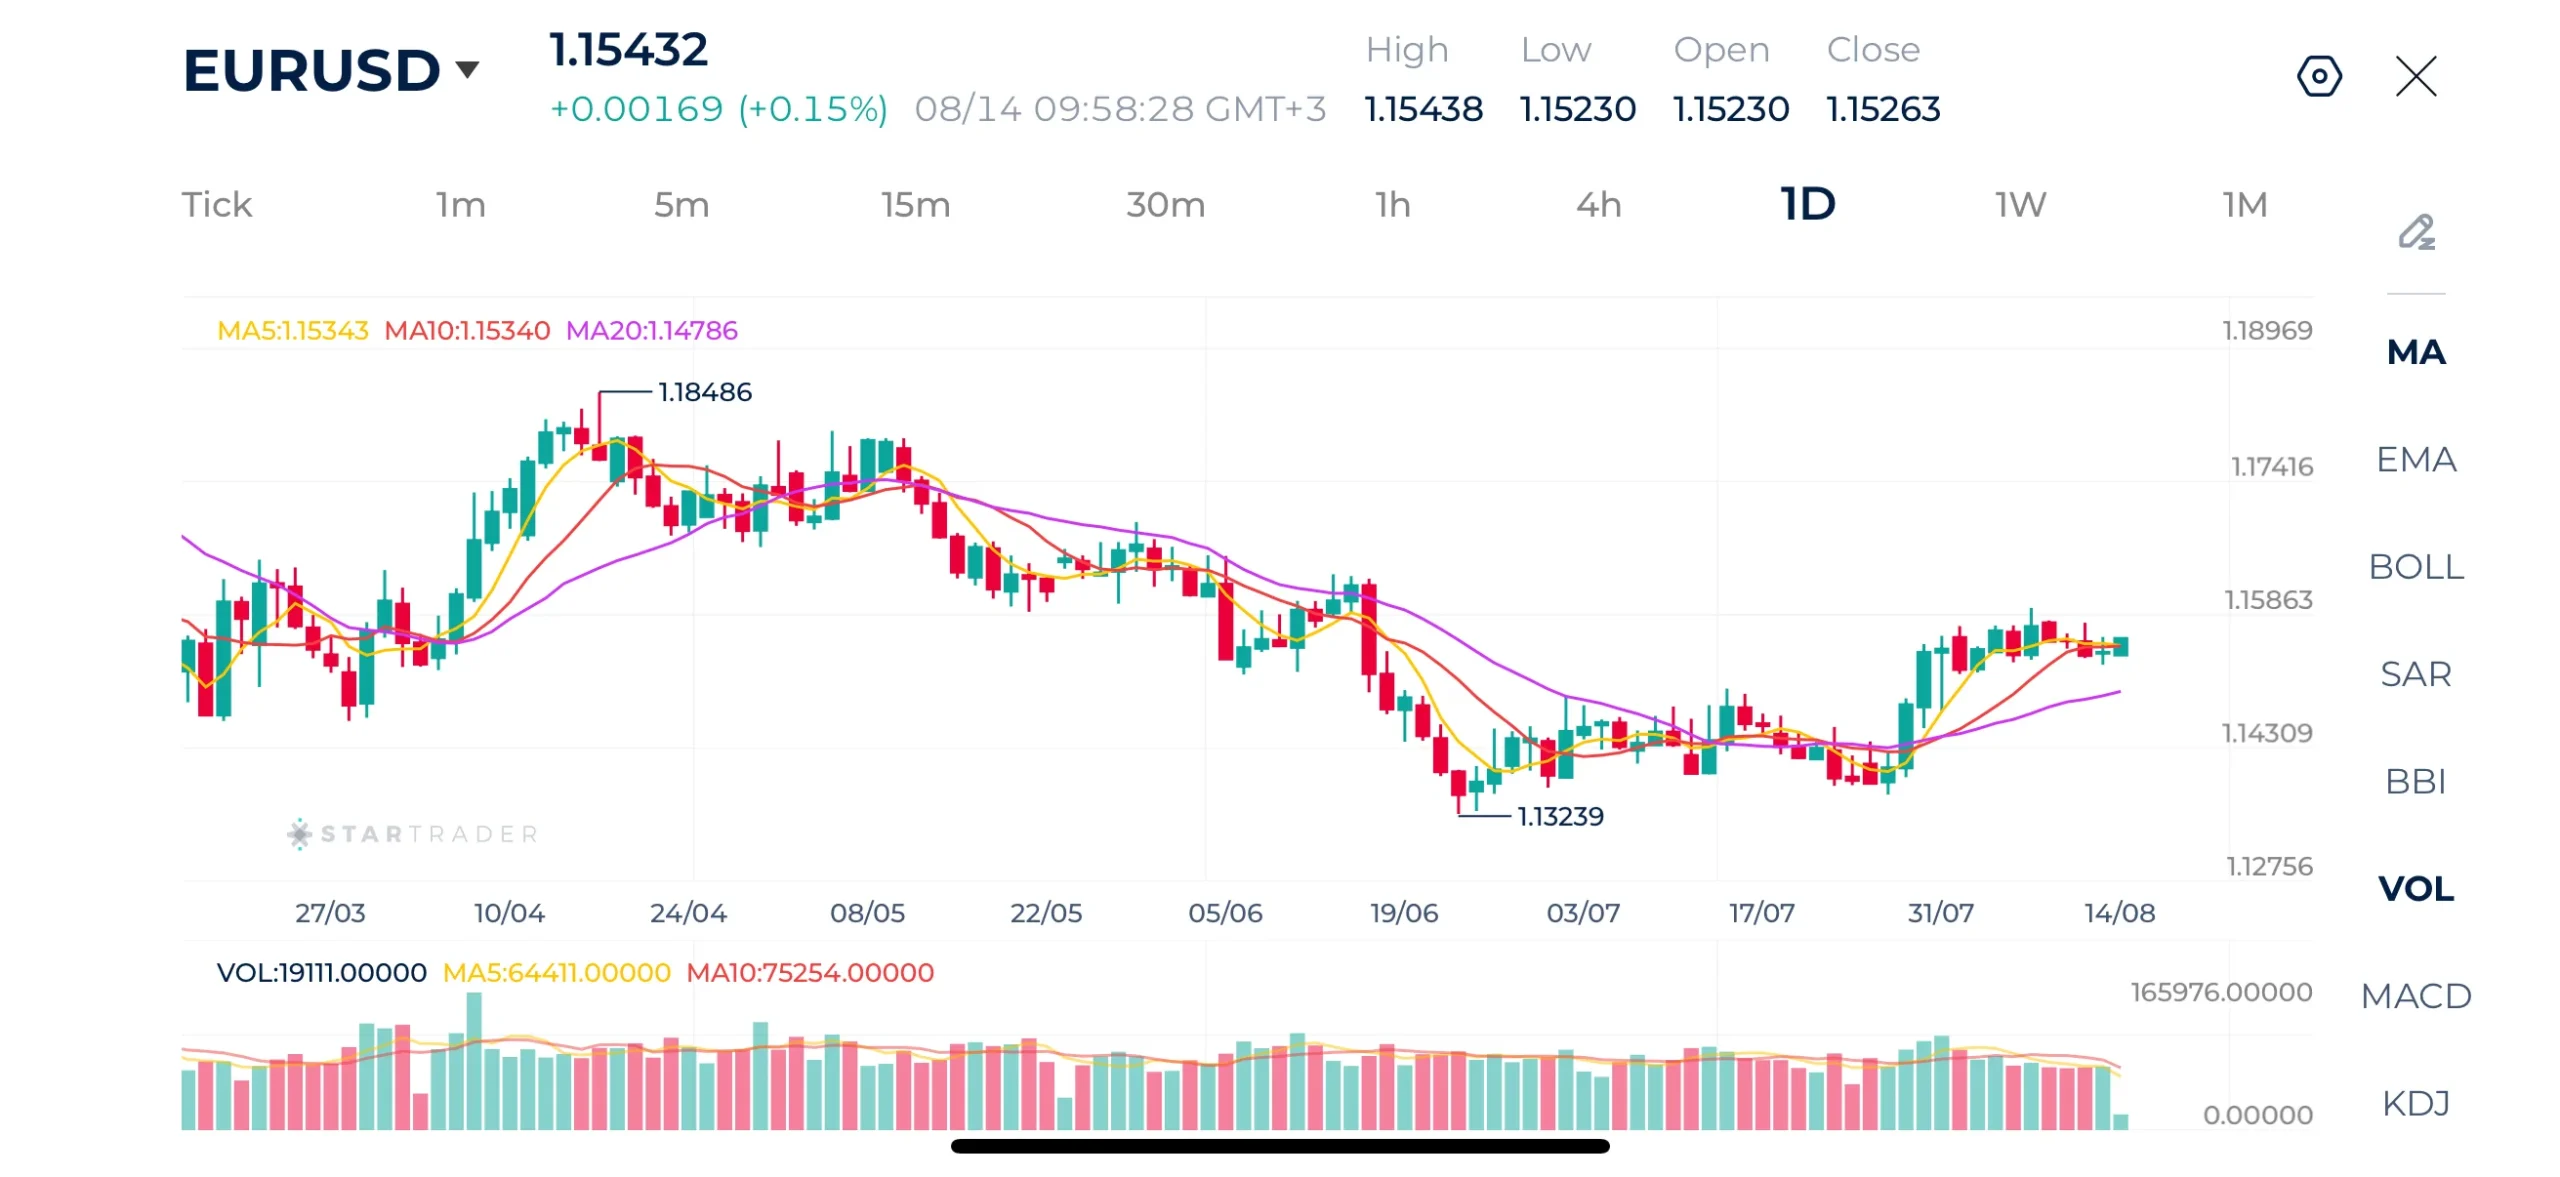
Source: STARTRADER app | EURUSD rebounds above 1.1500 level as the US dollar faces pressure
| Resistance | 1.1580 – 1.1591 | 1.1623 – 1.1640 | 1.1678 – 1.1685 |
|---|---|---|---|
| Support | 1.1487 – 1.1500 | 1.1460 – 1.1470 | 1.1386 – 1.1400 |
S&P 500 Technical Analysis
The S&P 500 daily chart shows the index is maintaining a strong alignment above its short- and medium-term moving averages.
Trading near 7,800, the S&P 500 remains comfortably in a bullish alignment, with price sitting above the 5-day, 10-day, and 20-day moving averages. The upward slope of these moving averages confirms intact momentum. Volume has leveled off following the late July expansion, indicating that price is currently digesting gains near all-time highs. Key dynamic support lies at the 10-day moving average around 7,745, while major resistance is marked by the recent peak near 7,825.
S&P 500 Daily Chart
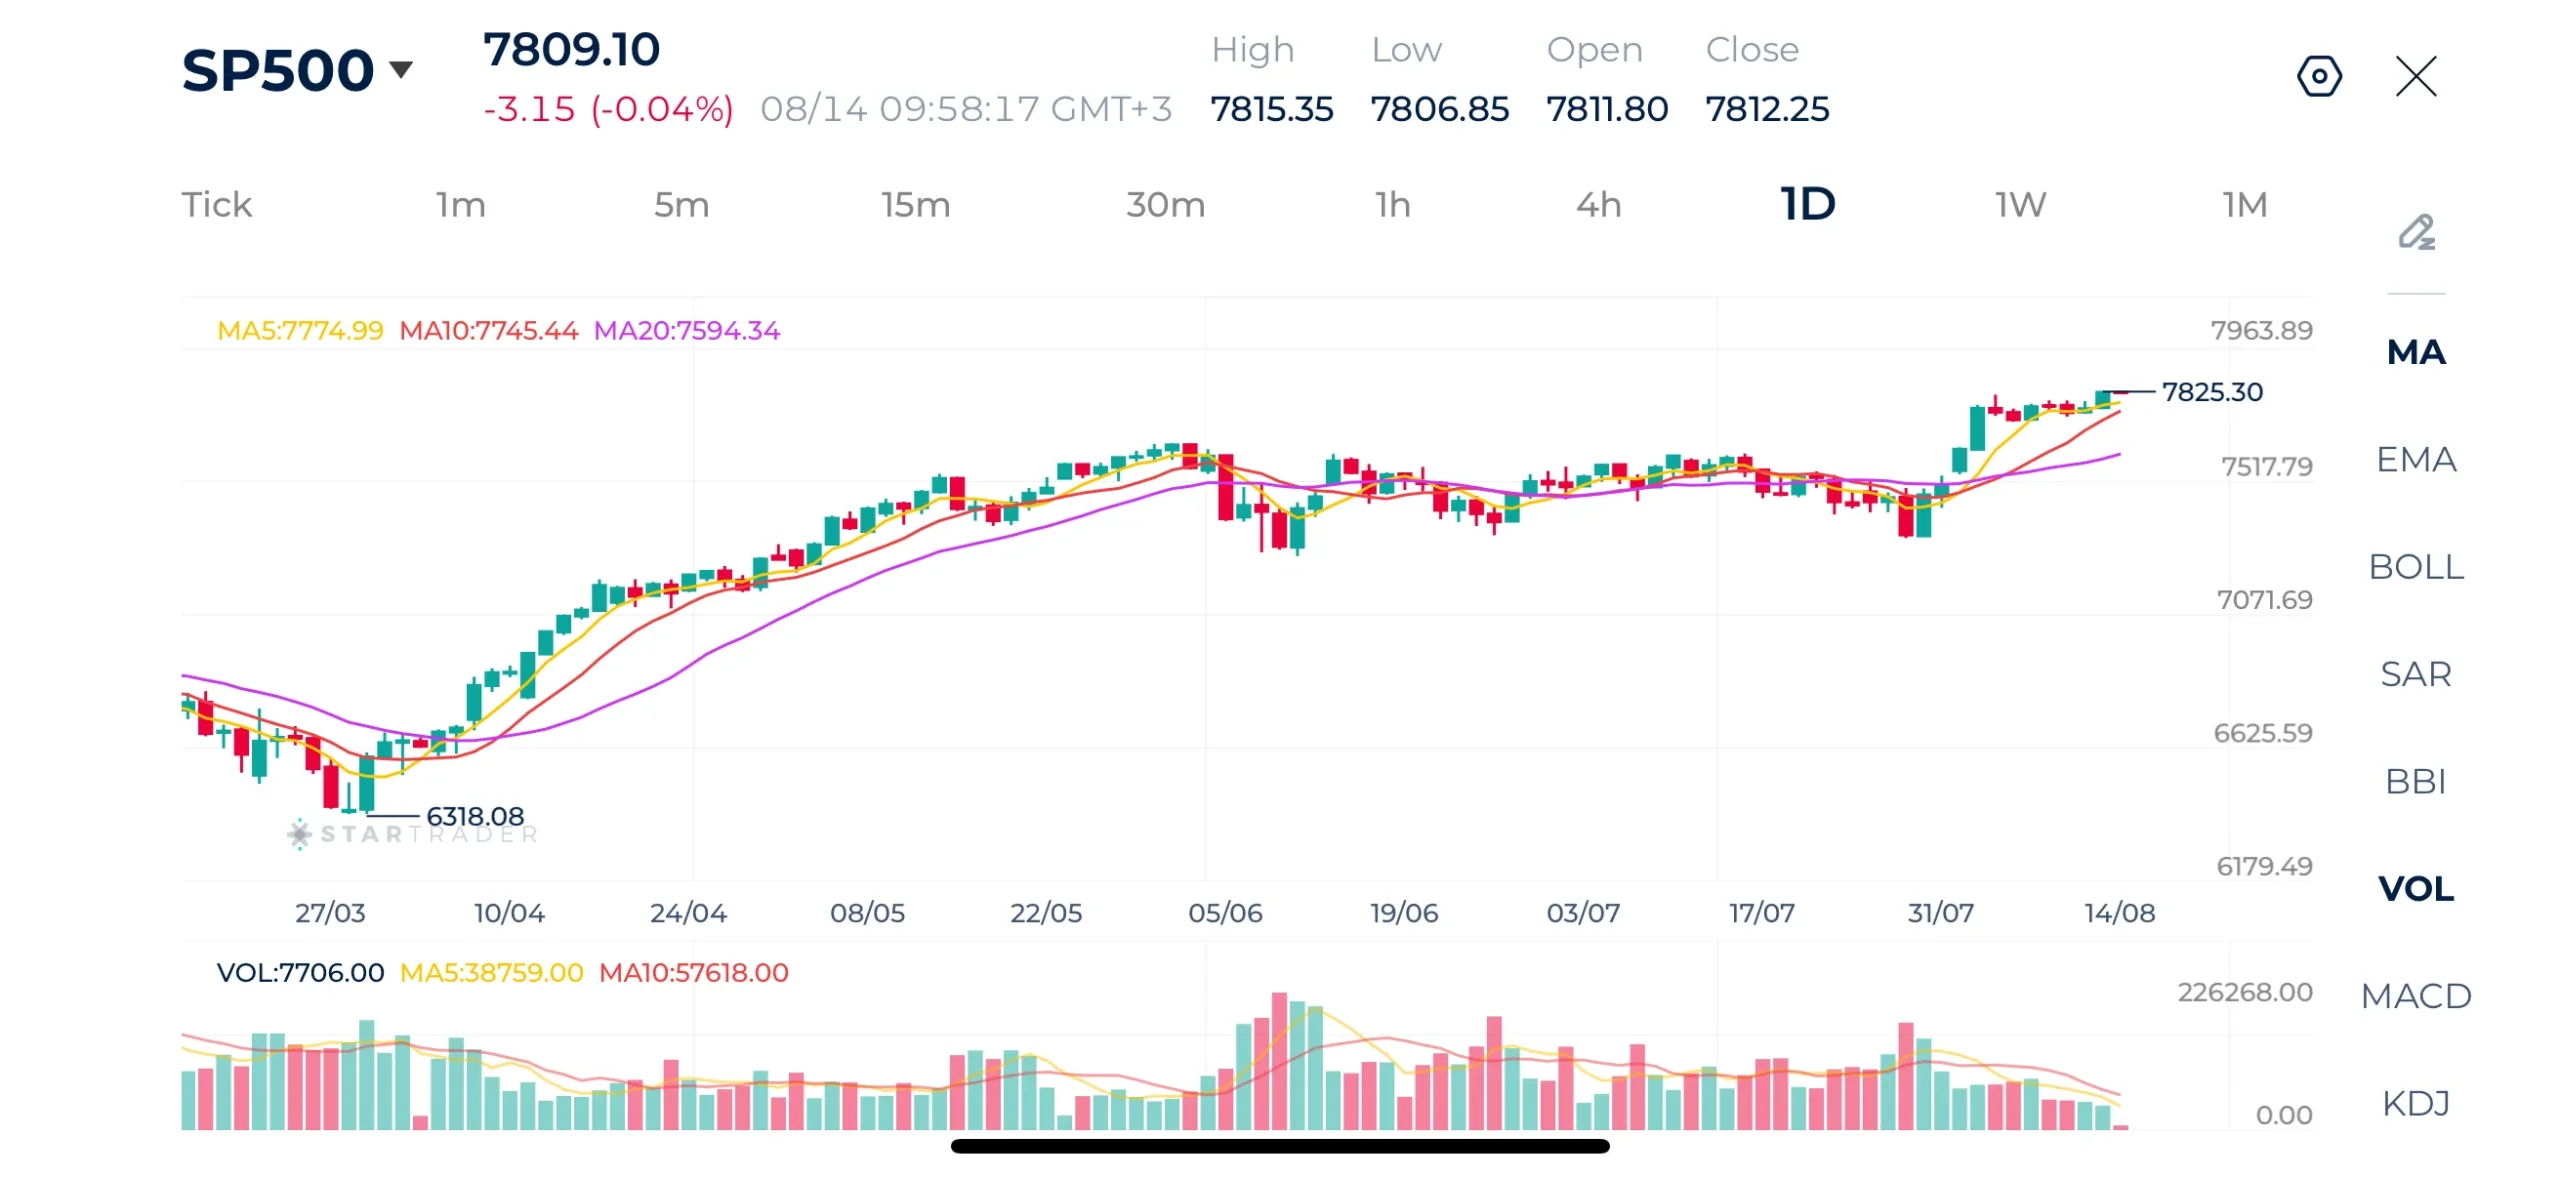
Source: STARTRADER app | S&P 500 breaks a new record high above 7,800 on cooling inflation
| Resistance | 7,825 – 7,840 | 7,890 – 7,900 | 7,950 – 7,966 |
|---|---|---|---|
| Support | 7,700 – 7,705 | 7,638 – 7,645 | 7,500 – 7,510 |
Gold Technical Analysis
The daily chart for Gold shows price forming higher lows before executing a sharp upside move in early August that cleared dynamic resistance layers.
Currently trading at $4,334, gold experienced a slight pullback from its recent local high near $4,400. Despite tthe recent decline, price remains supported above the 10-day and 20-day moving average. The 5-day moving average is serving as short-term overhead resistance. As long as price holds above the $4,280 level, the recent breakout structure remains intact, with potential retest of the $4,400 to $4,540 resistance zone.
Gold Daily Chart
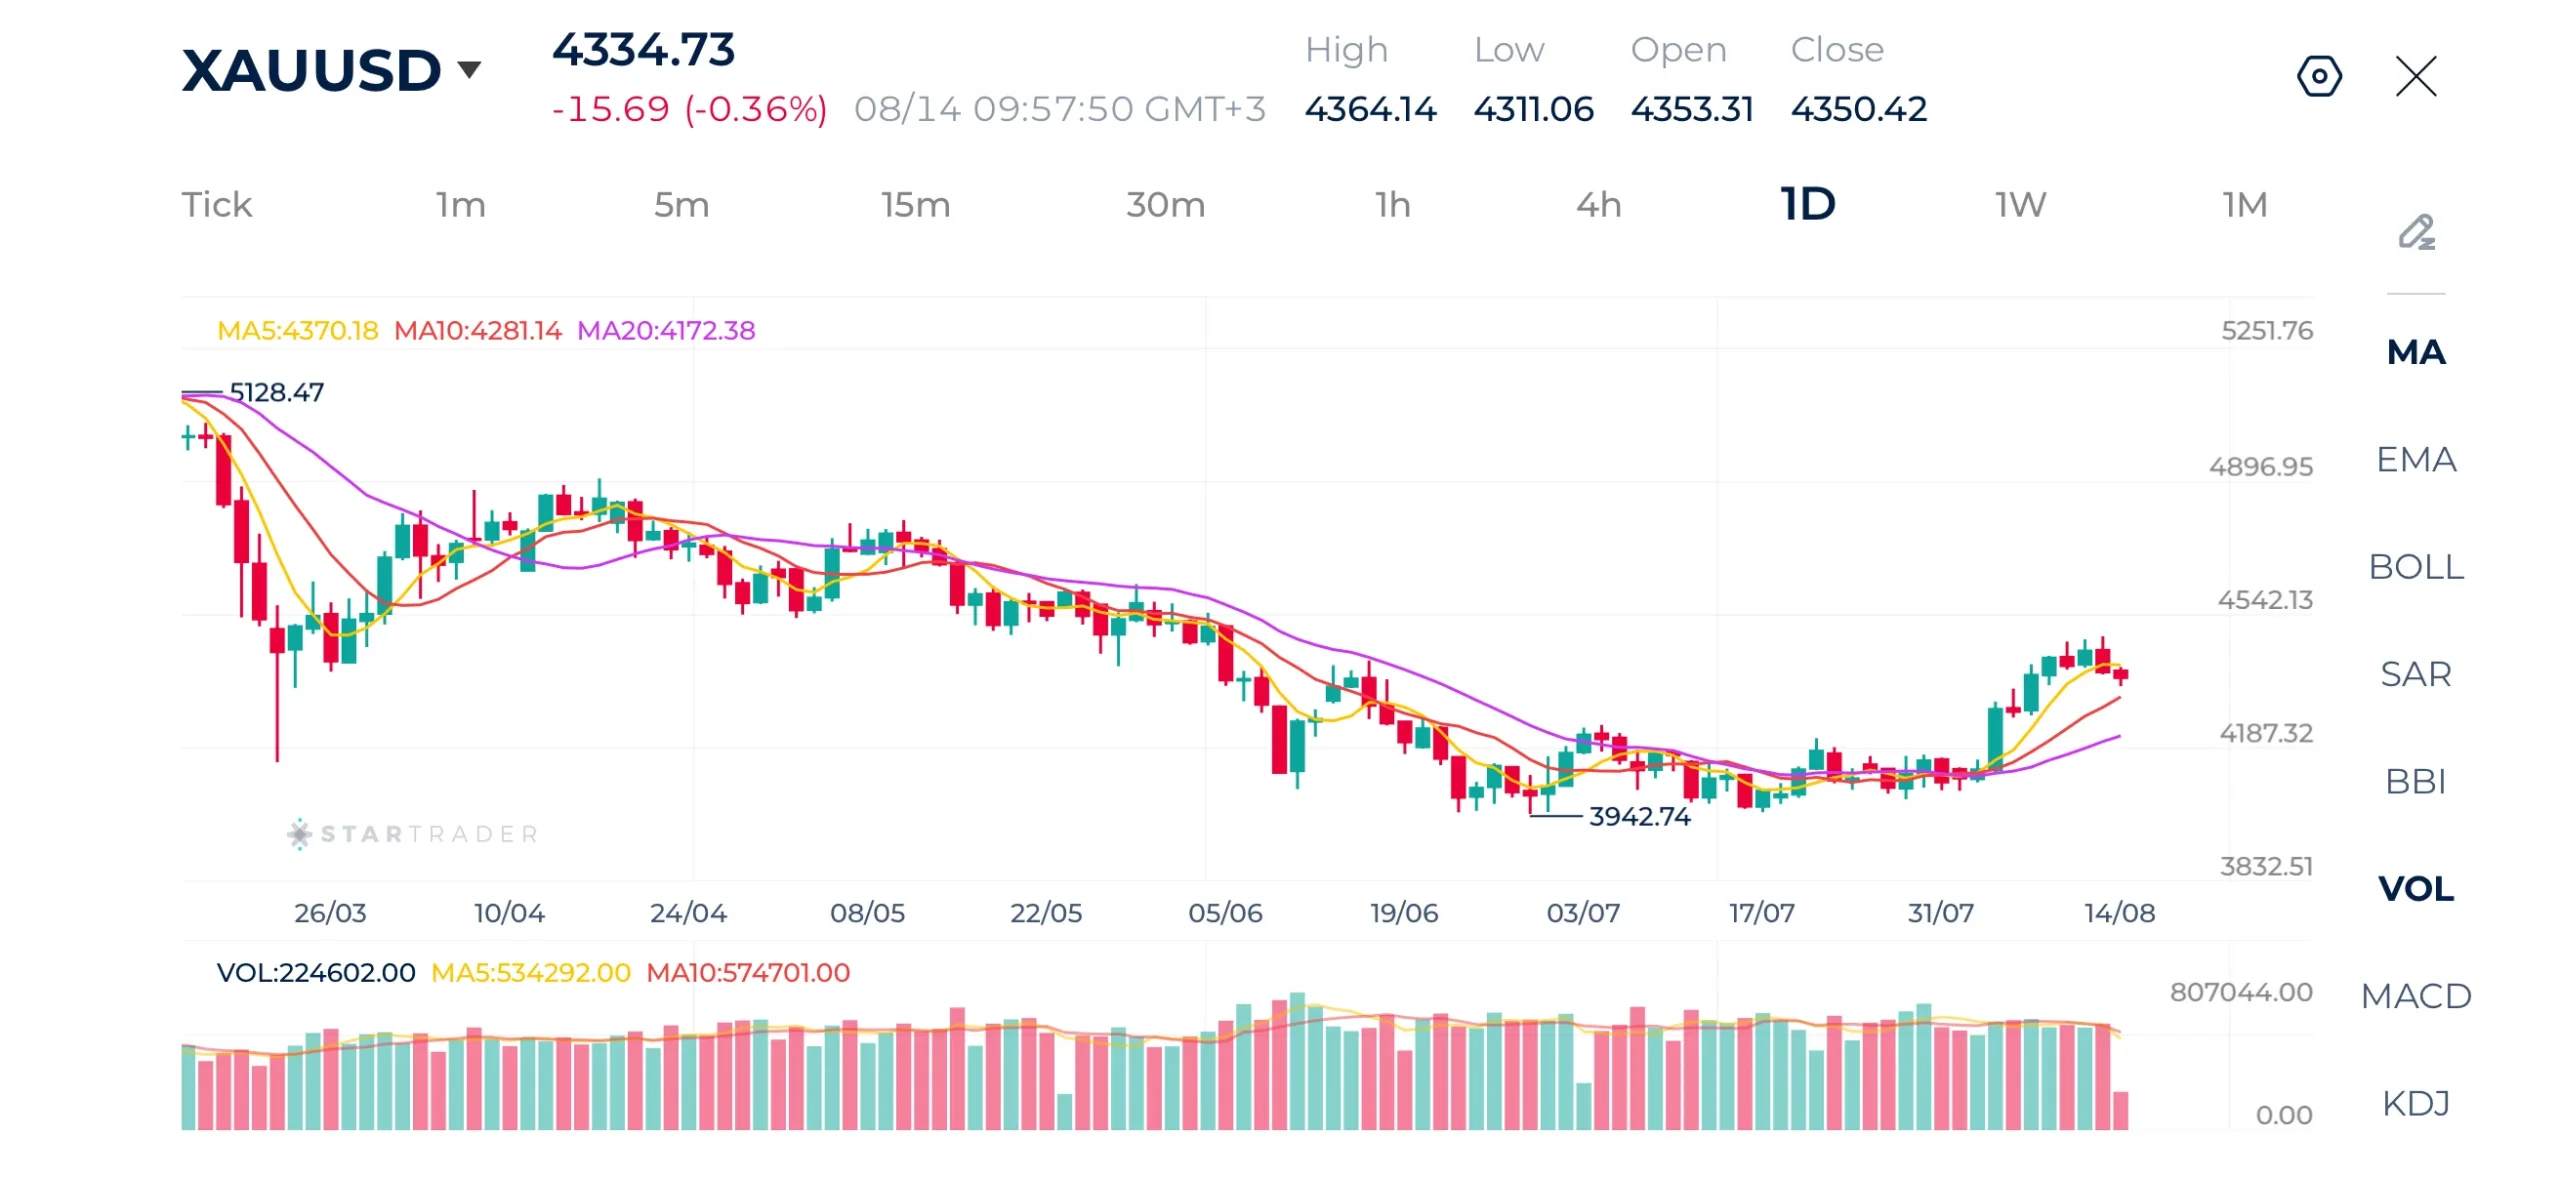
Source: STARTRADER app | Gold recovers above $4,400 but faces clear resistance
| Resistance | $4,449 – $4,457 | $4,522 – $4,540 | $4,597 – $4,612 |
|---|---|---|---|
| Support | $4,286 – $4,300 | $4,200 – $4,219 | $4,127 – $4,135 |
Risk Disclaimer: This material is provided for informational purposes only and does not constitute a recommendation or investment advice. Trading financial instruments on margin involves substantial risk and may not be appropriate for all investors.
Tags


Open Live Account
 Email Address
 Phone Number
Important Notice
STARTRADER does not accept any applications from Australian residents.
To comply with regulatory requirements, clicking the button will redirect you to the STARTRADER website operated by STARTRADER PRIME GLOBAL PTY LTD (ABN 65 156 005 668), an authorized Australian Financial Services Licence holder (AFSL no. 421210) regulated by the Australian Securities and Investments Commission.
Important Notice for Residents of the United Arab Emirates
In alignment with local regulatory requirements, individuals residing in the United Arab Emirates are requested to proceed via our dedicated regional platform at startrader.ae, which is operated by STARTRADER Global Financial Consultation & Financial Analysis L.L.C.. This entity is licensed by the UAE Capital Market Authority (CMA) under License No. 20200000241, and is authorised to introduce financial services and promote financial products in the UAE.
Please click the "Continue" button below to be redirected.


