








 Web Trader MT5









Key Takeaways
- Renewed optimism around U.S.–Iran negotiations improved global risk sentiment and supported equities throughout the week.
- U.S. stock indices extended their rallies, with the S&P 500 and Nasdaq reaching fresh record highs as geopolitical fears eased and investors rotated back into risk assets.
- Oil prices declined overall, as hopes for diplomacy reduced the geopolitical risk premium built into crude markets.
- Gold advanced above $4,850, benefiting from a weaker U.S. dollar and renewed demand for portfolio hedging.
- The U.S. dollar softened, allowing major currencies such as the euro and pound to strengthen.
- Crypto markets stabilized and moved higher, supported by stronger equity sentiment and improving risk appetite.
- Markets ended the week with a clear message: investors are pricing de-escalation, but confidence remains sensitive to headlines.
U.S. Stock Market Rally Continues
U.S. equities delivered another strong performance this week, extending the sharp rebound seen since the ceasefire period began. The S&P 500 surged above 7,050, hitting a new record high while the Nasdaq 100 also reached new all-time highs above 26,400. The Dow Jones Industrial Average climbed above 48,700, remaining near record territory.
The rally was driven by easing geopolitical tensions, renewed hopes for a formal U.S.–Iran agreement, and continued enthusiasm around technology and AI-related stocks. Investors also welcomed falling oil prices, which helped reduce fears of a prolonged inflation shock.
Despite the bullish momentum, sentiment remains highly headline driven. Any setback in negotiations could quickly trigger profit taking after such a strong V-shaped recovery.
Oil Drops While Gold Rises
Oil prices moved lower overall during the week as markets reduced the geopolitical premium that had built up during the conflict. Brent crude eased toward the mid-$90s, while WTI traded around $90–$92 by week end, well below the March highs above $110.
The decline was driven by hopes that U.S.–Iran negotiations could produce a more durable agreement, reducing the risk of supply disruptions and easing pressure around the Strait of Hormuz.
In contrast, gold strengthened and moved toward the $4,900 area, supported by a softer dollar, declining real yields, and continued investor demand for hedging despite improving equity sentiment. Silver also advanced, extending its multi-week recovery. This combination, falling oil and rising gold, suggests markets are pricing less immediate war risk, but not full macro stability.
Forex Market Performance
The forex market was defined by broad U.S. dollar weakness this week. The US Dollar Index DXY moved lower, as safe haven demand eased and traders reassessed the need for aggressive dollar positioning. A softer dollar supported major currencies across the board.
Major Moves:
- EUR/USD rose toward 1.1780, posting a strong week.
- GBP/USD strengthened to nearly 1.3600, supported by USD weakness and improving global sentiment.
- USD/JPY softened, as the dollar lost momentum despite still-elevated U.S. yields.
Crypto Market
Cryptocurrencies benefited from the broader return in risk appetite.
Bitcoin climbed back above $75,000, while Ethereum and several large-cap altcoins posted gains longside rising equity markets. The crypto rebound reflected stronger sentiment, reduced macro stress, and renewed speculative participation. Although momentum improved, crypto remains sensitive to macro headlines. Any sudden deterioration in geopolitics or a stronger dollar could quickly cap upside.
Outlook for Next Week (20–24 April 2026)
Key Events to Watch:
U.S.–Iran Negotiations: Markets are likely to remain highly reactive to any progress or setbacks. A confirmed deal could extend the rally in equities and pressure oil further.
Stocks: Indices remain strong, but after multiple record highs, short term consolidation or profit taking would be normal.
Oil: Further downside is possible if diplomacy advances, while renewed tensions could quickly reverse the move higher.
Gold: Gold may stay supported if the dollar remains weak, even in a risk-on environment.
Forex: A continued DXY pullback could support EUR/USD and GBP/USD further.
Crypto: Bitcoin and altcoins may continue recovering if global risk sentiment remains positive.
Major Economic Calendar Events for the Upcoming Week
| Date | Metric | Country | Previous | Time [Dubai] |
| Monday, 20 April | Consumer Price Index y/y | Canada | 2.40% | 4:30 PM |
| Tuesday, 21 April | Consumer Price Index q/q | New Zealand | 0.60% | 2:45 AM |
| Tuesday, 21 April | Claimant Count Change | UK | 24.7K | 10:00 AM |
| Tuesday, 21 April | Retail Sales m/m | USA | 0.60% | 4:30 PM |
| Wednesday, 22 April | Consumer Price Index y/y | UK | 3.00% | 10:00 AM |
| Thursday, 23 April | Flash Manufacturing PMI | Euro | 51.6 | 12:00 PM |
| Thursday, 23 April | Flash Services PMI | Euro | 50.2 | 12:00 PM |
| Thursday, 23 April | Flash Manufacturing PMI | UK | 51 | 12:30 PM |
| Thursday, 23 April | Flash Services PMI | UK | 50.5 | 12:30 PM |
| Thursday, 23 April | Flash Manufacturing PMI | USA | 52.3 | 5:45 PM |
| Thursday, 23 April | Flash Services PMI | USA | 49.8 | 5:45 PM |
| Friday, 24 April | Retail Sales m/m | UK | -0.40% | 10:00 AM |
Technical Analysis and Forecast:
Brent Technical Analysis
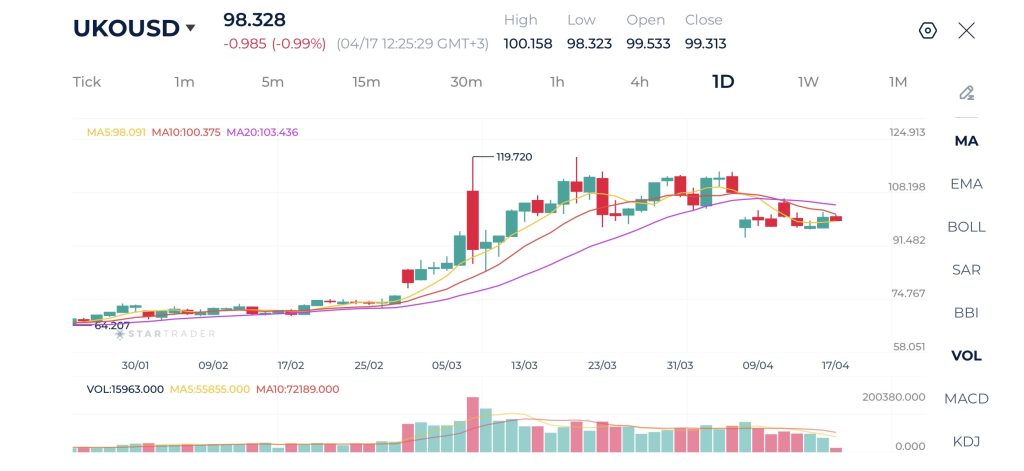
Brent crude is undergoing a deeper pullback after rallying to the recent peak. Price has now fallen toward $98.30, trading below the moving averages MA5 and MA10, while the MA20 near $103.43 acts as resistance. This setup suggests bullish momentum has cooled and the market is currently in correction mode.
Immediate resistance is located at $100.30–$103.40. Bulls need to reclaim that area to stabilize sentiment and attempt a broader recovery. On the downside, support is found near $96.00, then $91.50. If sellers break below those levels, downside pressure could intensify. For now, Brent remains neutral to bearish unless it reclaims the MA20 zone.
Brent Daily Chart
| Resistance | $96.25 – $96.40 | $98.66 – $98.80 | $100.00 – $100.23 |
| Support | $91.48 – $91.60 | $88.65 – $88.79 | $86.27 – $86.40 |
Gold Technical Analysis
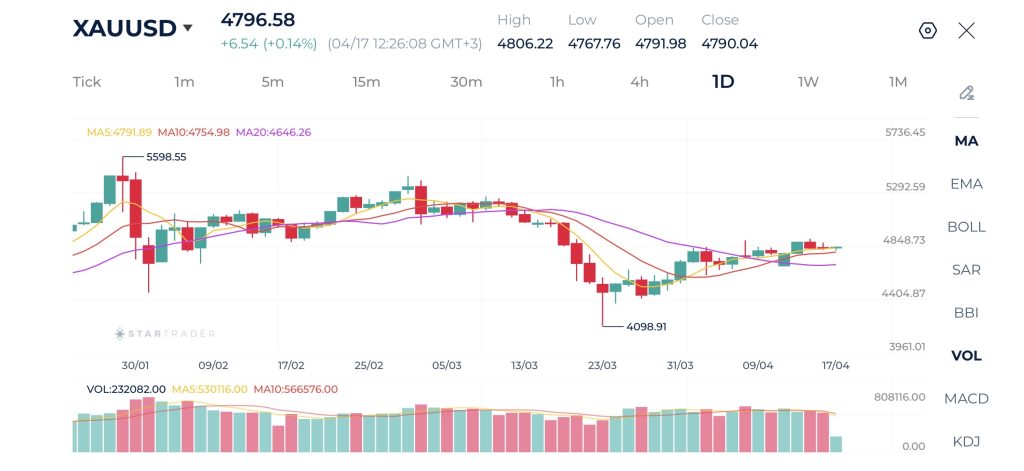
Gold remains constructive on the daily chart but is currently moving sideways after recovering sharply from the 4,100 low. Price is trading around the major $4,848 resistance zone, while MA5 and MA10 are flattening near current price, signaling a pause in momentum. The MA20 remains lower and rising, which keeps the medium term recovery structure intact.
A sustained break above $4,848 would strengthen bullish continuation prospects and open room for another push higher. If price fails to clear resistance, the market may remain range-bound between $4,750–$4,850. Initial support is near $4,755, followed by stronger support around $4,646. Overall bias is neutral to bullish while price remains above the rising MA20.
Gold Daily Chart
| Resistance | $4,883 – $4,900 | $4,982 – $5,000 | $5,167 – $5,180 |
| Support | $4,638 – $4,645 | $4,559 – $4,570 | $4,404 – $4,420 |
S&P 500 Technical Analysis
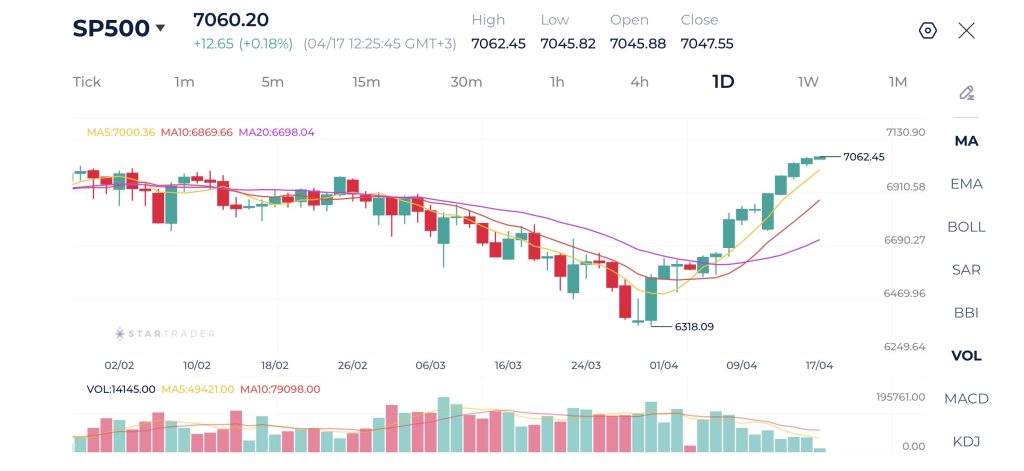
The S&P 500 has delivered a powerful bullish reversal from the 6,318 low and is now trading near the recent 7,062 high. Price is well above the MA5, MA10, and MA20, with moving averages positively stacked and momentum clearly favoring buyers. The sharp recovery suggests a strong risk appetite and continued institutional demand.
Resistance is now at 7,062–7,130. A breakout above this zone would confirm the continuation of the uptrend and open the door for further record highs. Support is seen at 7,000, followed by 6,910 and then the MA20 near 6,698. Unless price loses those supports, the trend remains firmly bullish and dips may continue to attract buyers.
S&P 500 Daily Chart
| Resistance | 7,080 – 7,100 | 7,156 – 7,180 | 7,280 – 7,300 |
| Support | 7,000 – 7,014 | 6,923 – 6,940 | 6,833 – 6,850 |
Bitcoin Technical Analysis
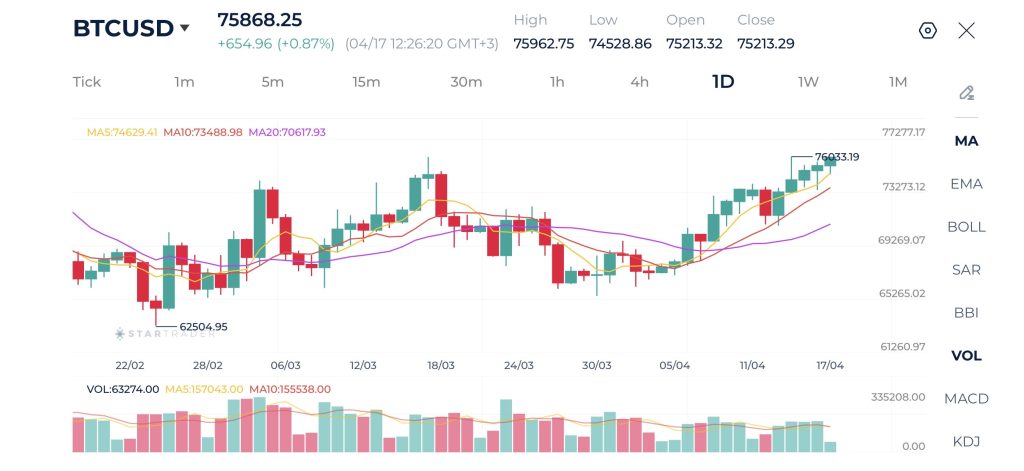
Bitcoin continues to show strong upside momentum on the daily timeframe after rebounding from the $62,504 low and pushing toward the recent.
$76,033 high. Price is trading firmly above the MA5, MA10, and MA20, with all moving averages aligned upward, confirming a healthy bullish trend. The recent sequence of higher highs and higher lows suggests buyers remain in control and dip demand is still strong.
The key resistance zone is now $76,000–$77,300. A decisive breakout above this area could trigger another leg higher and potentially accelerate momentum buying. On the downside, first support is seen near $74,600, followed by stronger support around $73,200 and then the MA20 near $70,600. As long as Bitcoin holds above those levels, the broader outlook remains bullish with pullbacks likely viewed as corrective rather than trend-changing.
Bitcoin Daily Chart
| Resistance | $79,431 – $79,560 | $80,474 – $80,657 | $85,319 – $85,450 |
| Support | $73,386 – $73,400 | $70,546 – $70,560 | $67,932 – $67,980 |
Risk Disclaimer: This material is provided for informational purposes only and does not constitute a recommendation or investment advice. Trading financial instruments on margin involves substantial risk and may not be appropriate for all investors.
Tags


Open Live Account
 Email Address
 Phone Number
Important Notice
STARTRADER does not accept any applications from Australian residents.
To comply with regulatory requirements, clicking the button will redirect you to the STARTRADER website operated by STARTRADER PRIME GLOBAL PTY LTD (ABN 65 156 005 668), an authorized Australian Financial Services Licence holder (AFSL no. 421210) regulated by the Australian Securities and Investments Commission.
Important Notice for Residents of the United Arab Emirates
In alignment with local regulatory requirements, individuals residing in the United Arab Emirates are requested to proceed via our dedicated regional platform at startrader.ae, which is operated by STARTRADER Global Financial Consultation & Financial Analysis L.L.C.. This entity is licensed by the UAE Capital Market Authority (CMA) under License No. 20200000241, and is authorised to introduce financial services and promote financial products in the UAE.
Please click the "Continue" button below to be redirected.


