








 Web Trader MT5













Key Takeaways
- Wall Street retreated from record highs as rising Treasury yields and pressure on technology stocks weighed on market sentiment ahead of earnings season.
- Federal Reserve September meeting minutes reinforced expectations of another rate hike before year-end, with persistent inflation keeping monetary policy firmly in focus.
- US Treasury yields surged to multi-decade highs amid hawkish Fed expectations, inflation concerns, heavy government borrowing, and rising AI-related financing needs.
- Crude oil prices remained volatile as escalating US–Iran tensions and potential disruptions in the Strait of Hormuz sustained geopolitical supply risks.
- Elevated bond yields and a stronger dollar pressured gold, although ongoing geopolitical tensions continued to support safe-haven demand.
US and global stock markets
US equities began the week on a positive note, with technology stocks pushing the Nasdaq Composite to a fresh record high. On Monday, the Nasdaq gained around 1%, the S&P 500 advanced 0.7%, and the Dow rose approximately 0.2%, supported by strong performances from Nvidia, Meta and Microsoft.
However, the rally lost momentum as the week progressed. Rising Treasury yields and renewed geopolitical concerns weighed on investor sentiment, particularly in technology and semiconductor stocks. By Thursday, the S&P 500 had fallen 0.5% to 7,765, while the Nasdaq dropped 1.3%. The Dow proved more resilient, edging up 0.1%.
Looking ahead, attention shifts to the start of the third-quarter earnings season, with major US banks including JPMorgan Chase scheduled to report next week. Earnings growth could help support equities, but companies will need to deliver strong results to offset pressure from higher yields and elevated valuations.
Geopolitical tensions drive oil volatility
Oil was one of the week’s most volatile assets. At the start of the week, Brent crude fell nearly 1.9% to $100.32 per barrel, while WTI declined around 1.8% to $89.43, as recovering export flows offered some relief to supply concerns.
Sentiment then shifted sharply. Reports that the US was considering renewed military operations against Iran, alongside attacks on shipping in the Strait of Hormuz and escalating regional hostilities, raised fears of further disruptions to global oil supplies. On Thursday, Brent surged more than 4% to above $104 per barrel, while WTI also advanced.
By Friday, Brent had retreated to around $103 per barrel as Trump stated the US will not attack before the midterm elections. The market remained caught between the risk of prolonged supply disruptions and hopes that tensions might ease.
Forecast for next week: Oil is likely to remain highly sensitive to headlines surrounding Iran, the Strait of Hormuz and regional shipping security. Any escalation could push prices higher, while credible signs of de-escalation or improving supply flows could trigger a pullback. Elevated oil prices also remain an inflation risk, potentially reinforcing expectations for tighter monetary policy.
The Federal Reserve sees another rate hike in 2026
The release of the Fed’s September meeting minutes was one of the week’s most important macroeconomic developments. The minutes showed that policymakers remained concerned about persistent inflation, with most participants judging that another rate hike would likely be appropriate before the end of the year. The September increase had been unanimous.
However, officials emphasized that future decisions would depend on incoming data. Markets continued to expect the Fed to hold rates steady at its October meeting, while the probability of a December hike remained elevated. .
Forecast for next week: Investors will focus on incoming inflation and economic data, comments from Fed officials, and the start of earnings season for clues about whether another hike in December remains likely. A stronger-than-expected inflation reading could lift the dollar and Treasury yields, while softer data could ease rate expectations and support equities and gold.
Gold remained pressured by a stronger dollar and rising yields
Gold struggled to recover from its recent two-month low as the stronger US dollar and elevated Treasury yields reduced its appeal. The prospect of another Fed rate hike before year-end has added pressure because gold does not pay interest, making yield-bearing assets more competitive when interest rates rise.
Meanwhile, the dollar benefited from higher US yields and safe-haven demand amid geopolitical uncertainty.
Forecast for next week: Gold’s direction will depend largely on US inflation data and the dollar. Softer inflation could weaken the dollar and support gold, while persistent price pressures and rising yields could extend the metal’s weakness. Renewed geopolitical escalation may provide gold with some safe-haven support, although a stronger dollar could limit the upside.
Major Economic Calendar Events for the Upcoming Week
| Date | Metric | Country | Previous | Time [Dubai] |
|---|---|---|---|---|
| Tuesday, 13 October | Existing Home Sales | USA | 3.98M | 6:00 PM |
| Wednesday, 14 October | Consumer Price Index y/y | USA | 3.4% | 4:30 PM |
| Thursday, 15 October | Employment Change | Australia | 39.5K | 4:30 AM |
| Thursday, 15 October | Unemployment Rate | Australia | 4.6% | 4:30 AM |
| Thursday, 15 October | Gross Domestic Product m/m | UK | 0.4% | 10:00 AM |
| Thursday, 15 October | Producer Price Index y/y | USA | 0.054 | 4:30 PM |
| Thursday, 15 October | Retail Sales m/m | USA | 1.2% | 4:30 PM |
| Thursday, 15 October | Unemployment Claims | USA | 4:30 PM | |
| Thursday, 15 October | Philadelphia Fed Manufacturing Index | USA | 37.8 | 4:30 PM |
| Friday, 16 October | Consumer Price Index y/y | Euro | 3.8% | 1:00 PM |
Technical Analysis and Forecast:
Gold Technical Analysis
Gold is trading around $4,192. Price has recently tested the $4,100 region, where buyers emerged and helped stabilize prices.
Immediate resistance is located around $4,200–$4,232, followed by $4,320 and the $4,400 region. Support is around $4,130, followed by $4,096 and the recent low near $3,943.
The current rebound suggests that buying interest is returning, but gold still needs to overcome the $4,200–$4,232 resistance zone to strengthen the recovery. A sustained move above this area could open the way toward $4,320. Conversely, a break below $4,096 would increase the risk of another decline toward the recent lows.
Outlook: Neutral to cautiously bullish in the short term, but the broader correction remains a concern until gold reclaims the $4,232 area.
Gold Daily Chart
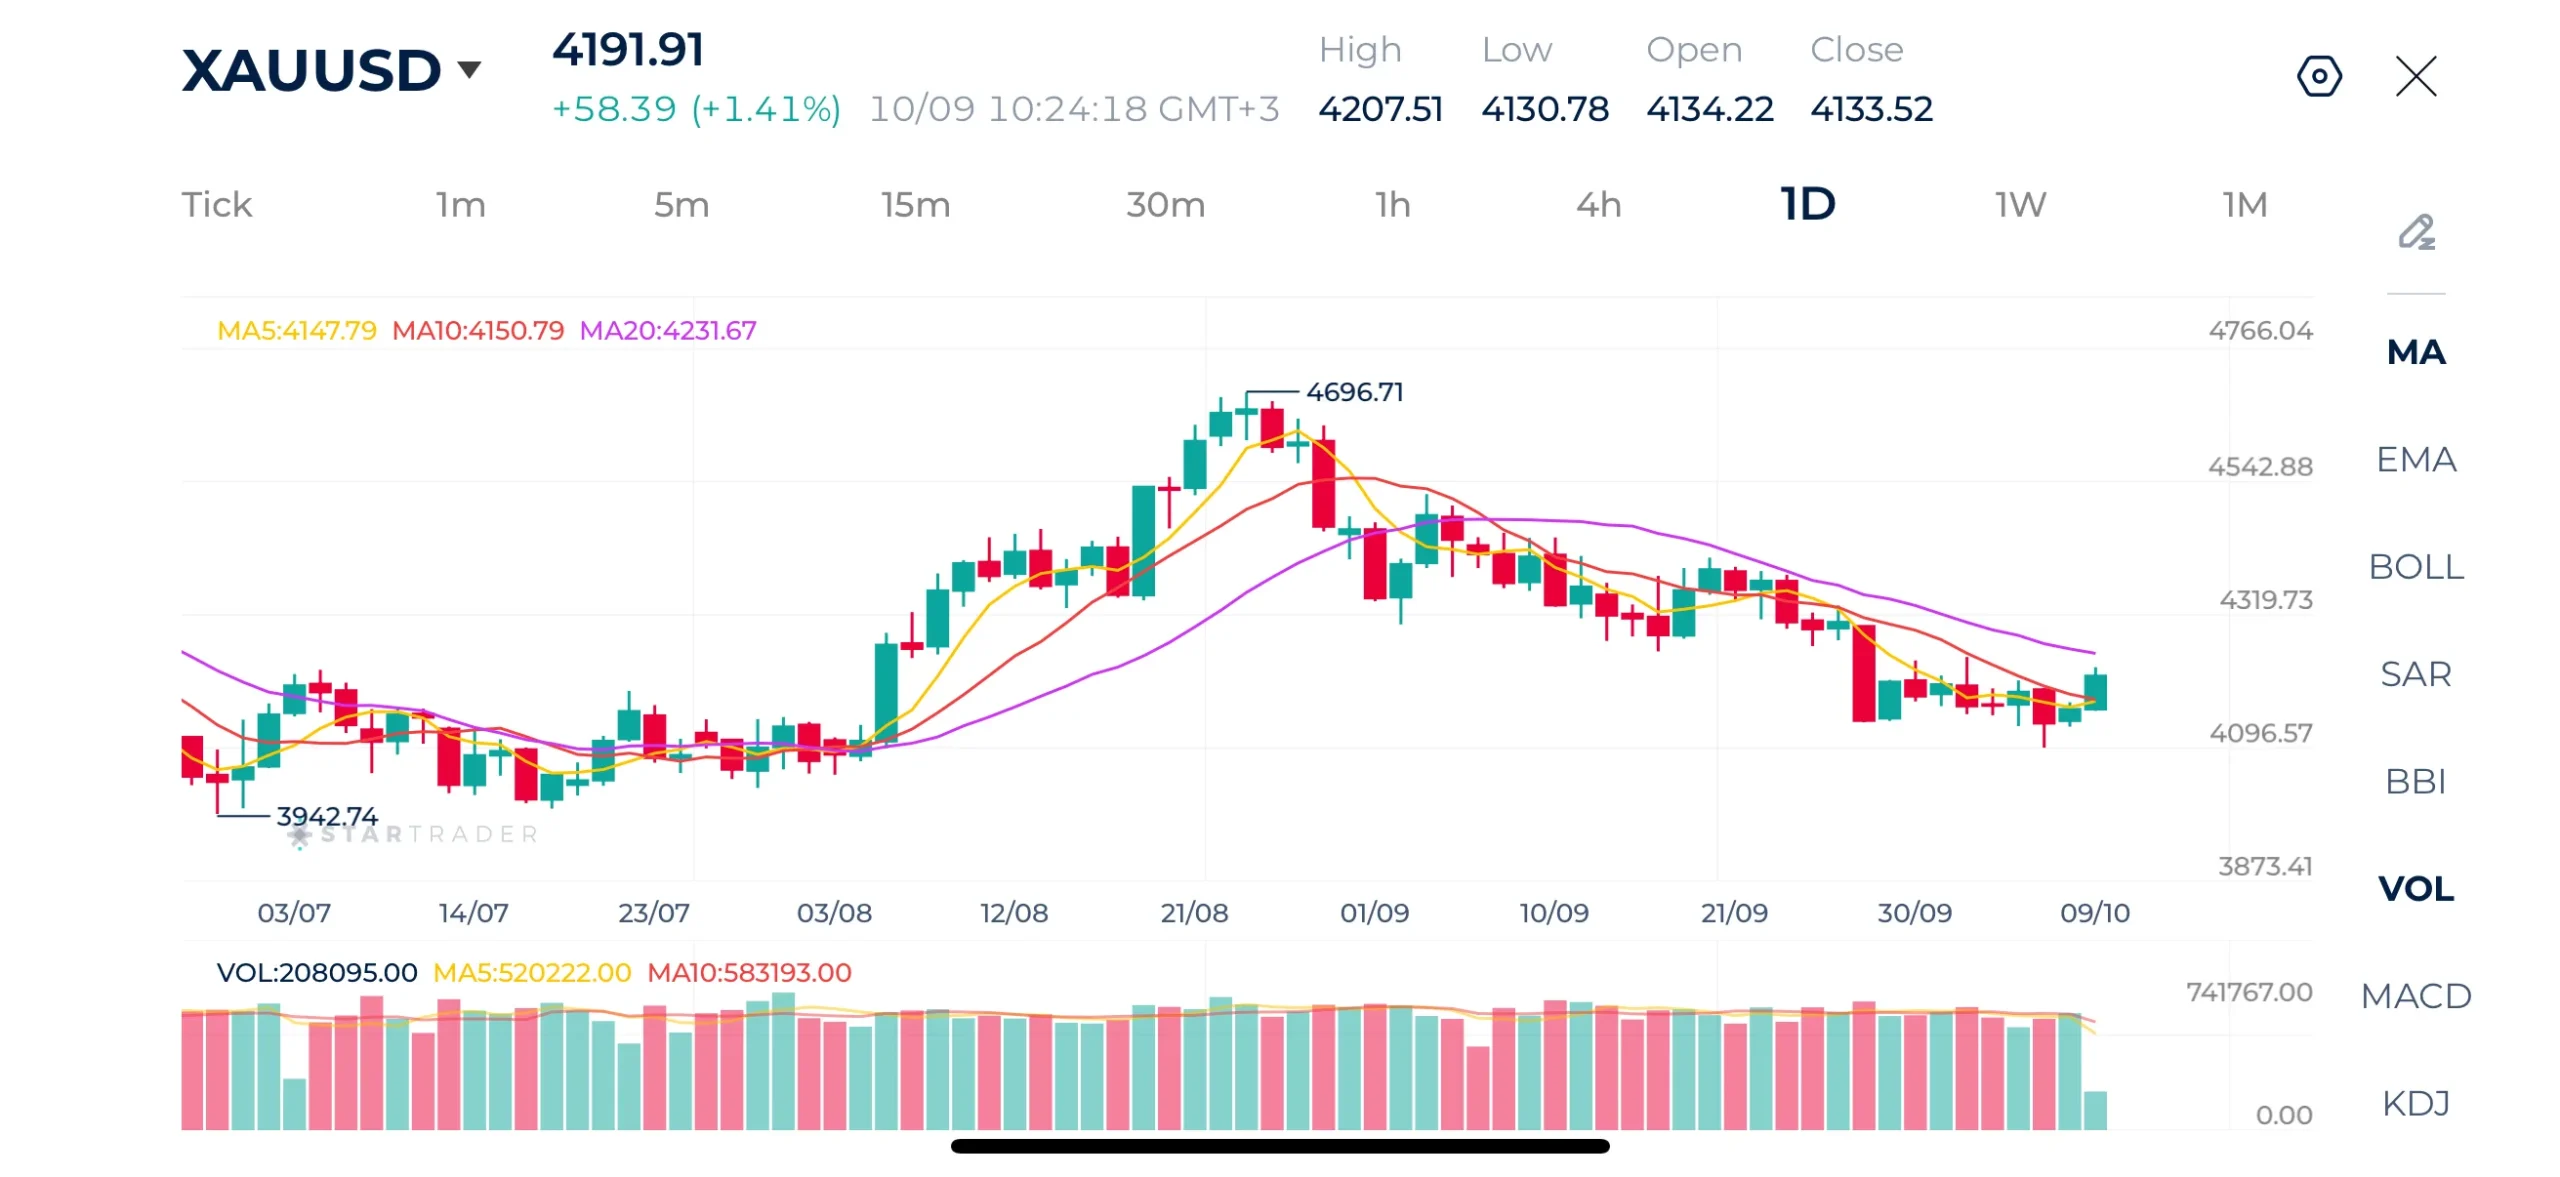
Source: STARTRADER app | Gold faces pressure from rising yields and a stronger dollar
| Resistance | $4,200 –$4,232 | $4,320 – $4,335 | $4,400 – $4,412 |
|---|---|---|---|
| Support | $4,130 – $4,135 | $4,096 – $4,100 | $3,943 – $3,950 |
Brent Technical Analysis
Brent crude is currently trading around $107.04. The broader trend remains bullish, with price trading above the two moving averages MA10 and the MA20. The moving averages are clustered beneath the current price, providing a potential support zone. Nevertheless, the latest candles indicate hesitation below the recent high.
Immediate resistance is located around $108.00–$108.50, followed by $110.42. On the downside, support is around $106.00, followed by $105.00 and the $102.15 region.
A sustained breakout above $108.50 could encourage another move toward $110.42. A decisive break above that high would reinforce the bullish trend. However, a decline below $105.00 would weaken the near-term structure and potentially expose the $102.15 support area.
Outlook: Bullish overall, but consolidating near resistance. A breakout above $110.42 would strengthen the upside case, while a break below $105.00 would signal a deeper correction.
Brent Daily Chart
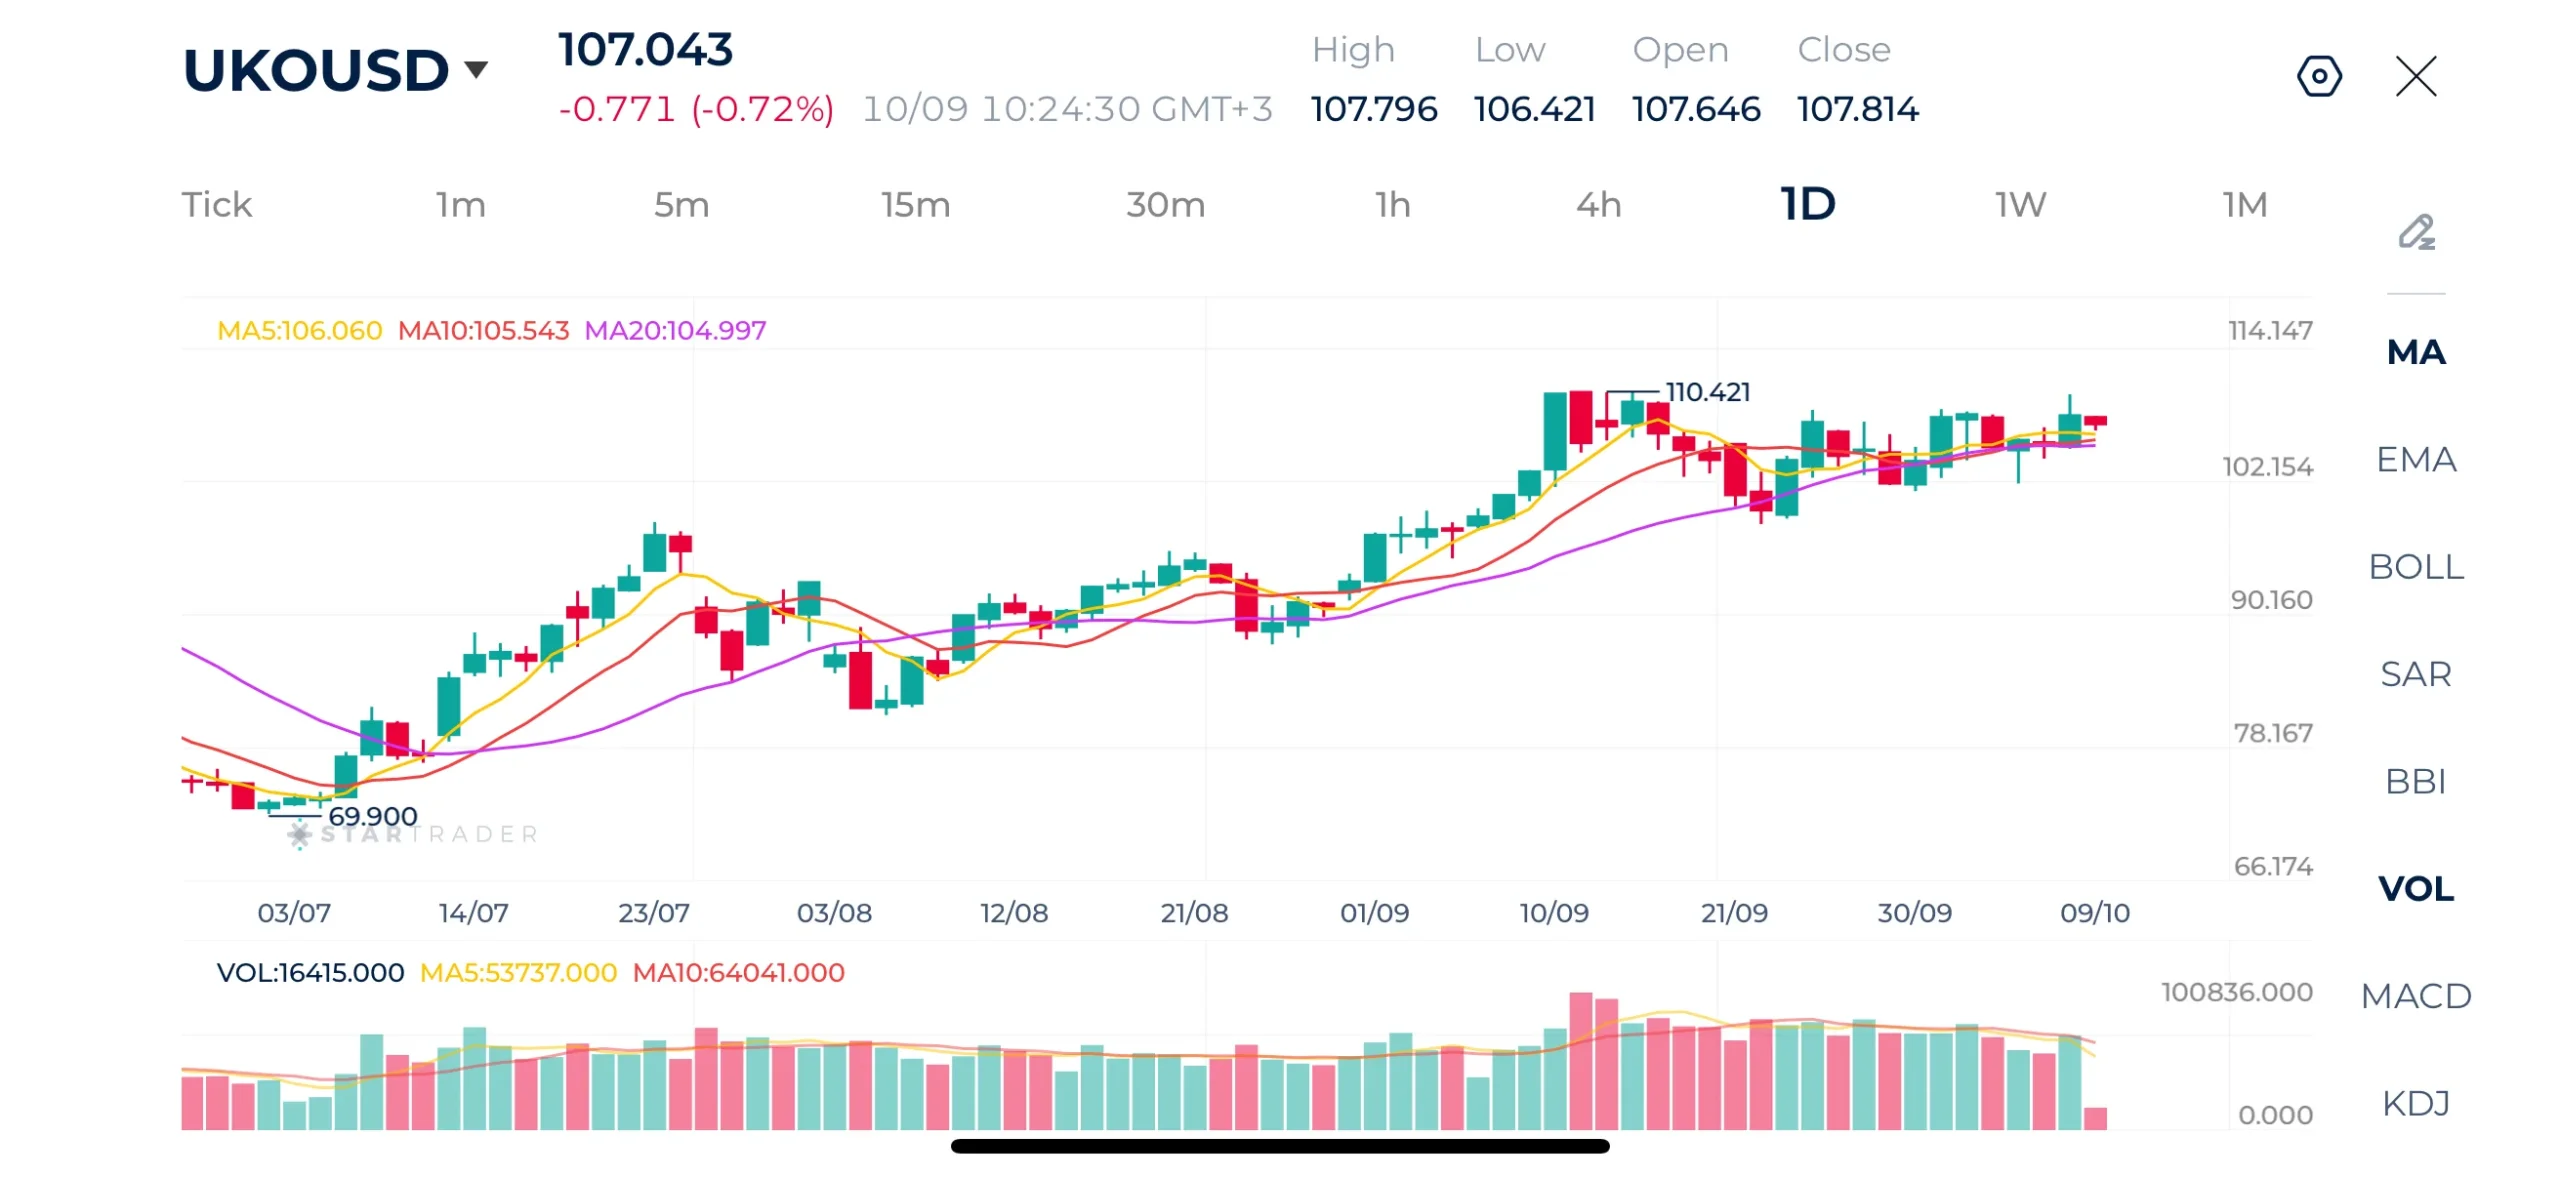
Source: STARTRADER app | Crude brent settles above $100 on continuous supply fears
| Resistance | $108.50 – $108.65 | $110.42 – $110.50 | $112.00 – $112.30 |
|---|---|---|---|
| Support | $106.00 – $106.13 | $105.00 – $105.21 | $103.77 – $104.00 |
Nasdaq Technical Analysis
Nasdaq 100 is trading around 31,027. The index has established a series of higher highs and higher lows, with the latest rally pushing it toward the recent peak at 31,404.
The moving averages continue to support the bullish outlook. Price is trading above the 10-day moving average and the 20-day moving average.
Immediate support is located around 30,523, followed by 30,000 and the 29,245 region. Resistance is concentrated around 31,250–31,405, with a confirmed breakout above the recent high potentially opening the way toward 31,800.
The index may experience short-term consolidation after its strong advance. However, as long as it holds above the 30,500 area, the bullish structure remains largely intact. A sustained break above 31,405 would strengthen the upside momentum, while a decline below 30,500 could trigger a deeper correction.
Outlook: Bullish, with potential for further gains if resistance at 31,405 is broken. Monitor whether buyers can defend the 30,500 support zone.
Nasdaq Daily Chart
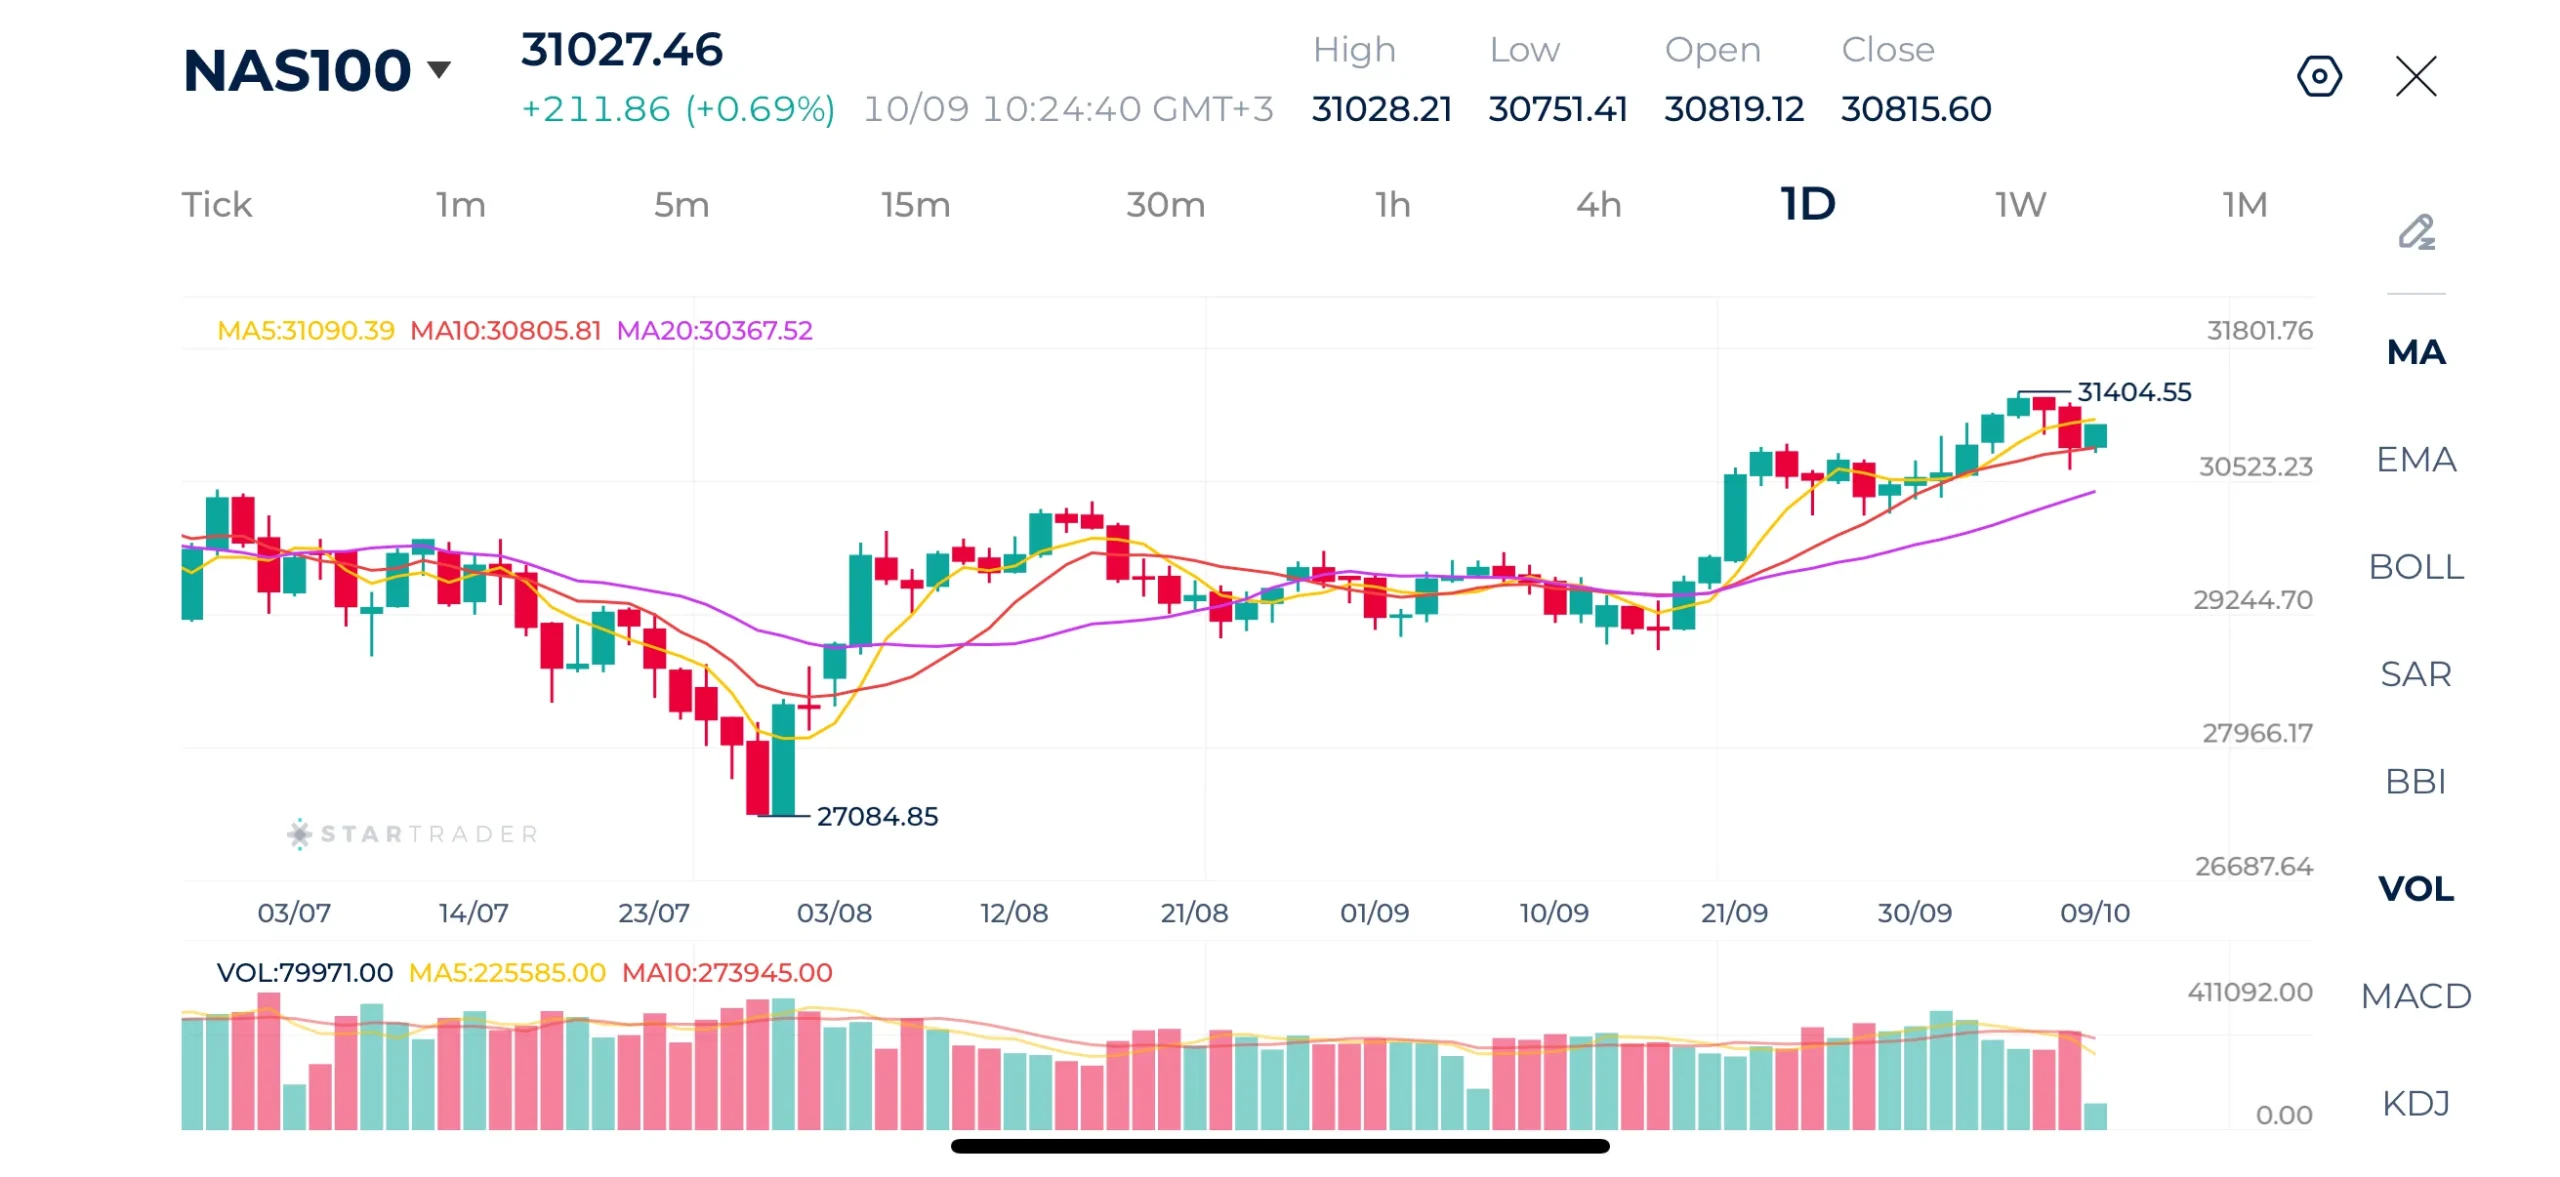
Sourcce: STARTRADER app | Nasdaq trades near recod highs, driven by AI stocks
| Resistance | 31,250 – 31,266 | 31,405 – 31,436 | 31,800 – 31,823 |
|---|---|---|---|
| Support | 30,500 – 30,523 | 29,976 – 30,000 | 29,245 – 29,260 |
EURUSD Technical Analysis
EURUSD is attempting a modest recovery after a prolonged decline from the August high of 1.1710. The pair recently reached a low of 1.1160, and the latest candles suggest that buyers are attempting to stabilize the market following the sharp sell-off.
However, the broader technical structure remains bearish. Price is trading below the 10-day and 20-day moving averages, while both longer moving averages are sloping downward. This suggests that selling pressure remains dominant despite the latest rebound.
Immediate support is located at 1.1160, followed by the psychological level of 1.1100. On the upside, resistance is around 1.1270, followed by 1.1360 and the 1.1435 region.
A sustained break below 1.1160 could extend the decline toward 1.1100. Conversely, a recovery above 1.1270 would improve the short-term outlook, although a stronger bullish reversal would require the pair to reclaim the 1.1360 area.
Outlook: Bearish, with the possibility of a short-term technical rebound. The key level to watch is 1.1160 on the downside and 1.1270 on the upside.
EURUSD Daily Chart
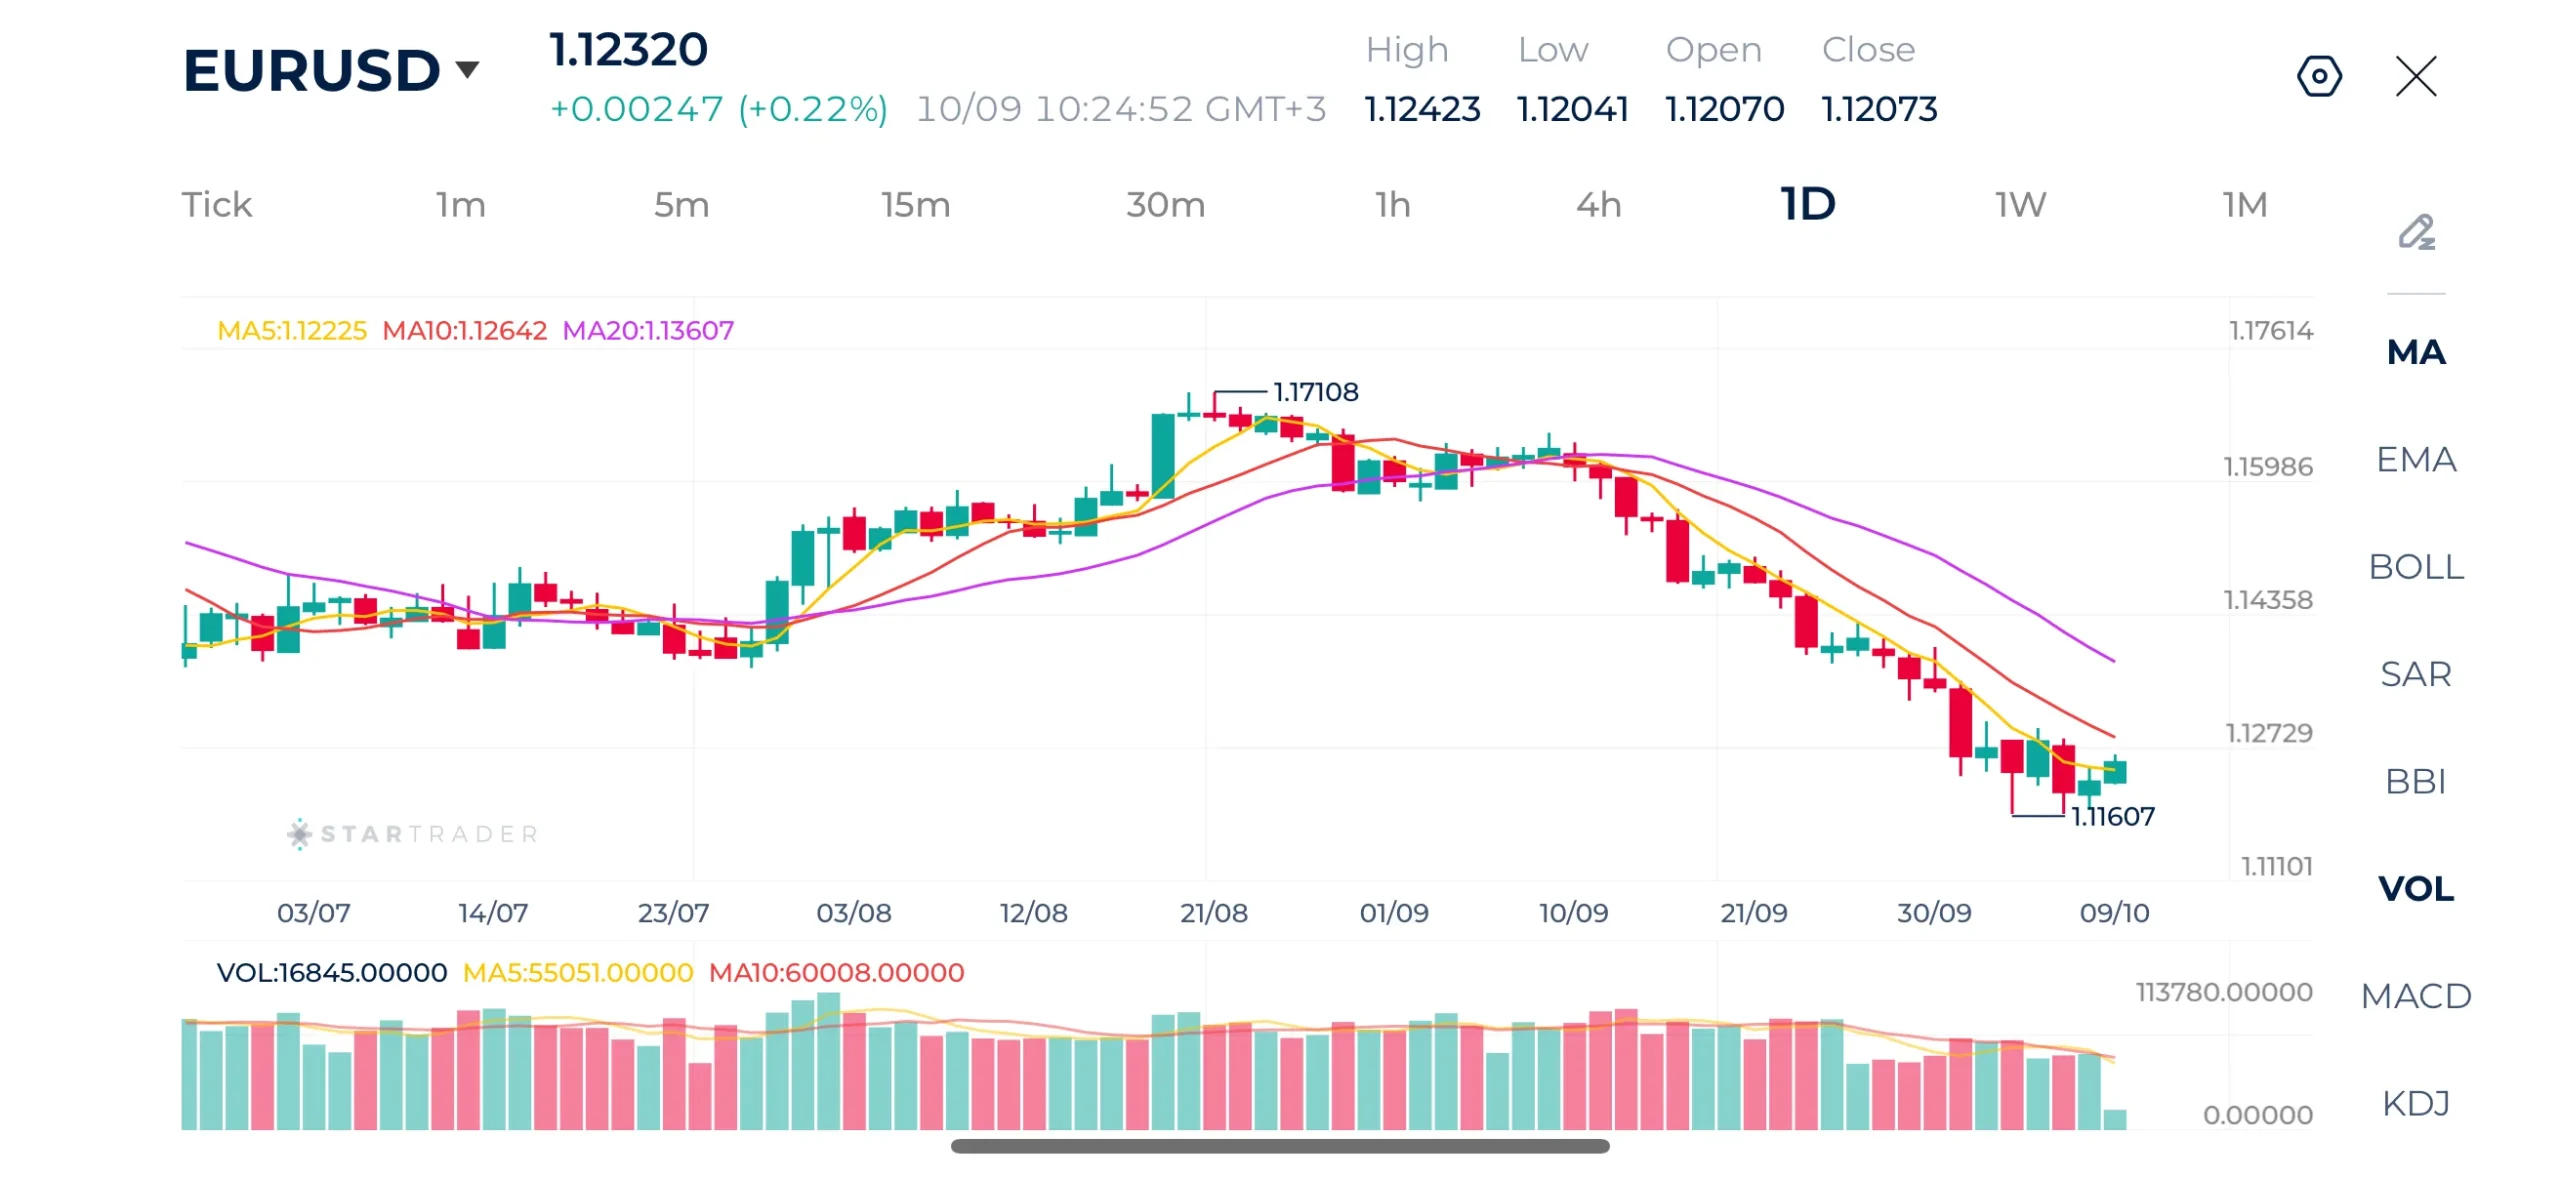
Source: STARTRADER app | Stronger dollar keeps EURUSD pair under selling pressure
| Resistance | 1.1270 – 1.1283 | 1.1360 – 1.1371 | 1.1435- 1.1456 |
|---|---|---|---|
| Support | 1.1160 – 1.1167 | 1.1100 – 1.1107 | 1.1067 – 1.1080 |
Risk Disclaimer: This material is provided for informational purposes only and does not constitute a recommendation or investment advice. Trading financial instruments on margin involves substantial risk and may not be appropriate for all investors.
Tags


Open Live Account
 Email Address
 Phone Number
Important Notice
STARTRADER does not accept any applications from Australian residents.
To comply with regulatory requirements, clicking the button will redirect you to the STARTRADER website operated by STARTRADER PRIME GLOBAL PTY LTD (ABN 65 156 005 668), an authorized Australian Financial Services Licence holder (AFSL no. 421210) regulated by the Australian Securities and Investments Commission.
Important Notice for Residents of the United Arab Emirates
In alignment with local regulatory requirements, individuals residing in the United Arab Emirates are requested to proceed via our dedicated regional platform at startrader.ae, which is operated by STARTRADER Global Financial Consultation & Financial Analysis L.L.C.. This entity is licensed by the UAE Capital Market Authority (CMA) under License No. 20200000241, and is authorised to introduce financial services and promote financial products in the UAE.
Please click the "Continue" button below to be redirected.


