








 Web Trader MT5









Key Takeaways
- Oil retreated as US-Iran de-escalation signals pulled Brent from above $80 back into the mid-$70s.
- ADP’s July print badly missed expectations (44K vs. 75K forecast), the weakest reading in six months, reviving concerns about a cooling labor market.
- Gold broke above $4,300, posting its best weekly close since January as falling oil, a softer dollar, and lower yields boosted non-yielding metal.
- The S&P 500 and Dow Jones notched fresh record highs, with the Dow topping 54,000 for the first time.
- Palantir’s blowout quarter and raised guidance pushed the stock 30% higher.
Oil Slides on Hormuz Optimism
The week opened with markets fixated once again on the Strait of Hormuz, but this time the was in a positive direction. Oil had spiked into the weekend after President Trump called off what he described as a major planned strike on Iran, and Brent initially reversed early gains to drop more than 4% below $80 a barrel. That decline extended through midweek as diplomatic signals turned constructive. Brent slid further, dropping below $79 while WTI fell toward $75 after losing more than 10% combined over the prior two sessions.
By Wednesday and Thursday, the de-escalation narrative firmed up further. Additionally, OPEC+’s decision to raise output for a sixth consecutive month in September added incremental supply-side pressure.
ADP NFP Misses Expectations, Gold Breaks $4,300
Wednesday’s ADP employment report delivered the clearest sign yet that hiring momentum is fading. Private payrolls rose just 44,000 in July, the smallest gain in six months, badly missing the Dow Jones consensus of 75,000 and following a downwardly revised 95,000 gain in June.
Coming into the week, futures were pricing better-than-even odds of a rate hike at the September FOMC meeting. The CME FedWatch Tool had hike odds as high as 61.9% as of Monday.
The ADP miss chipped away at that positioning meaningfully, though it didn’t flip the outright bias entirely by Thursday, futures markets were still pricing around 57% odds of a hike, even as the weak print left the case for the hawkish dissenters considerably harder to defend.
Gold was the cleanest expression of the shifting narrative. The precious metal opened the week near $4,051 and climbed steadily as falling oil, a softer dollar and declining Treasury yields reduced the opportunity cost of holding non-yielding bullion. By Thursday, gold traded at $4,307, up more than 4% on the day and on pace for its most profitable weekly close since January.
Dow Jones and S&P 500 Post Fresh Records
Equities had one of their strongest weeks of the summer. The S&P 500 and Nasdaq had been in a slump through much of July, but from a low point on July 29 the Nasdaq surged nearly 9% into early August.
Monday saw the Dow close at a record high with Amazon briefly crossing a $3 trillion market cap. Tuesday was the standout session and the Dow added over 900 points to close above 54,000 for the first time ever, with the rally attributed to strong corporate earnings, a rebound in tech shares, and optimism over progress on reopening the Strait of Hormuz.
Forecast for the Week Ahead (August 10–14)
The macro calendar shifts from labor to inflation next week, and that handoff will likely dominate positioning. July CPI lands Wednesday, August 12, followed by July PPI on Thursday, August 13, both landing directly ahead of the September FOMC meeting and carrying outsized weight given how divided the Committee already is. A soft CPI print would reinforce the case the ADP and jobs data have been building and could accelerate gold’s rally and pressure the dollar further, a hot print would hand ammunition back to the hawkish dissenters and could unwind some of this week’s rate-sensitive moves in both directions.
On the geopolitical front, the Iran-Oman shipping arrangement remains provisional and explicitly not a full reopening of the Strait of Hormuz, so any breakdown in that arrangement, a fresh Houthi incident in the Red Sea, or a stalling of the broader US-Iran talks could quickly reverse this week’s oil decline and revive the inflation-risk-premium trade that had pressured gold and rate-cut bets earlier in the summer.
For equities, the key question is whether the Nasdaq and S&P can extend record highs into a seasonally weak stretch.
Major Economic Calendar Events for the Upcoming Week
| Date | Metric | Country | Previous | Time [Dubai] |
|---|---|---|---|---|
| Tuesday, 11 August | Interest Rate Decision | Australia | 4.35% | 8:30 AM |
| Tuesday, 11 August | Existing Home Sales | USA | 4.09M | 6:00 PM |
| Wednesday, 12 August | Consumer Price Index y/y | USA | 3.50% | 4:30 PM |
| Thursday, 13 August | Gross Domestic Product m/m | UK | 0.1% | 10:00 AM |
| Thursday, 13 August | Unemployment Claims | USA | 4:30 PM | |
| Thursday, 13 August | Producer Price Index m/m | USA | -0.3% | 4:30 PM |
| Friday, 14 August | Retail Sales m/m | USA | 0.2% | 4:30 PM |
Technical Analysis and Forecast:
Gold Technical Analysis
Gold has staged a strong recovery after forming a medium-term bottom near $3,943, ending the multi-month corrective phase. The recent breakout above the 20-day moving average and the subsequent move above both the 5-day and 10-day moving averages indicate that bullish momentum is returning. The moving averages are beginning to turn higher, suggesting the uptrend is gradually rebuilding.
However, after rallying toward $4,300, price is approaching a key resistance zone that previously acted as an important support area during the broader correction. Some profit-taking or short-term consolidation would therefore be healthy before another leg higher.
The medium-term outlook remains constructive as long as gold holds above the 20-day moving average around $4,080-$4,100.
Gold Daily Chart
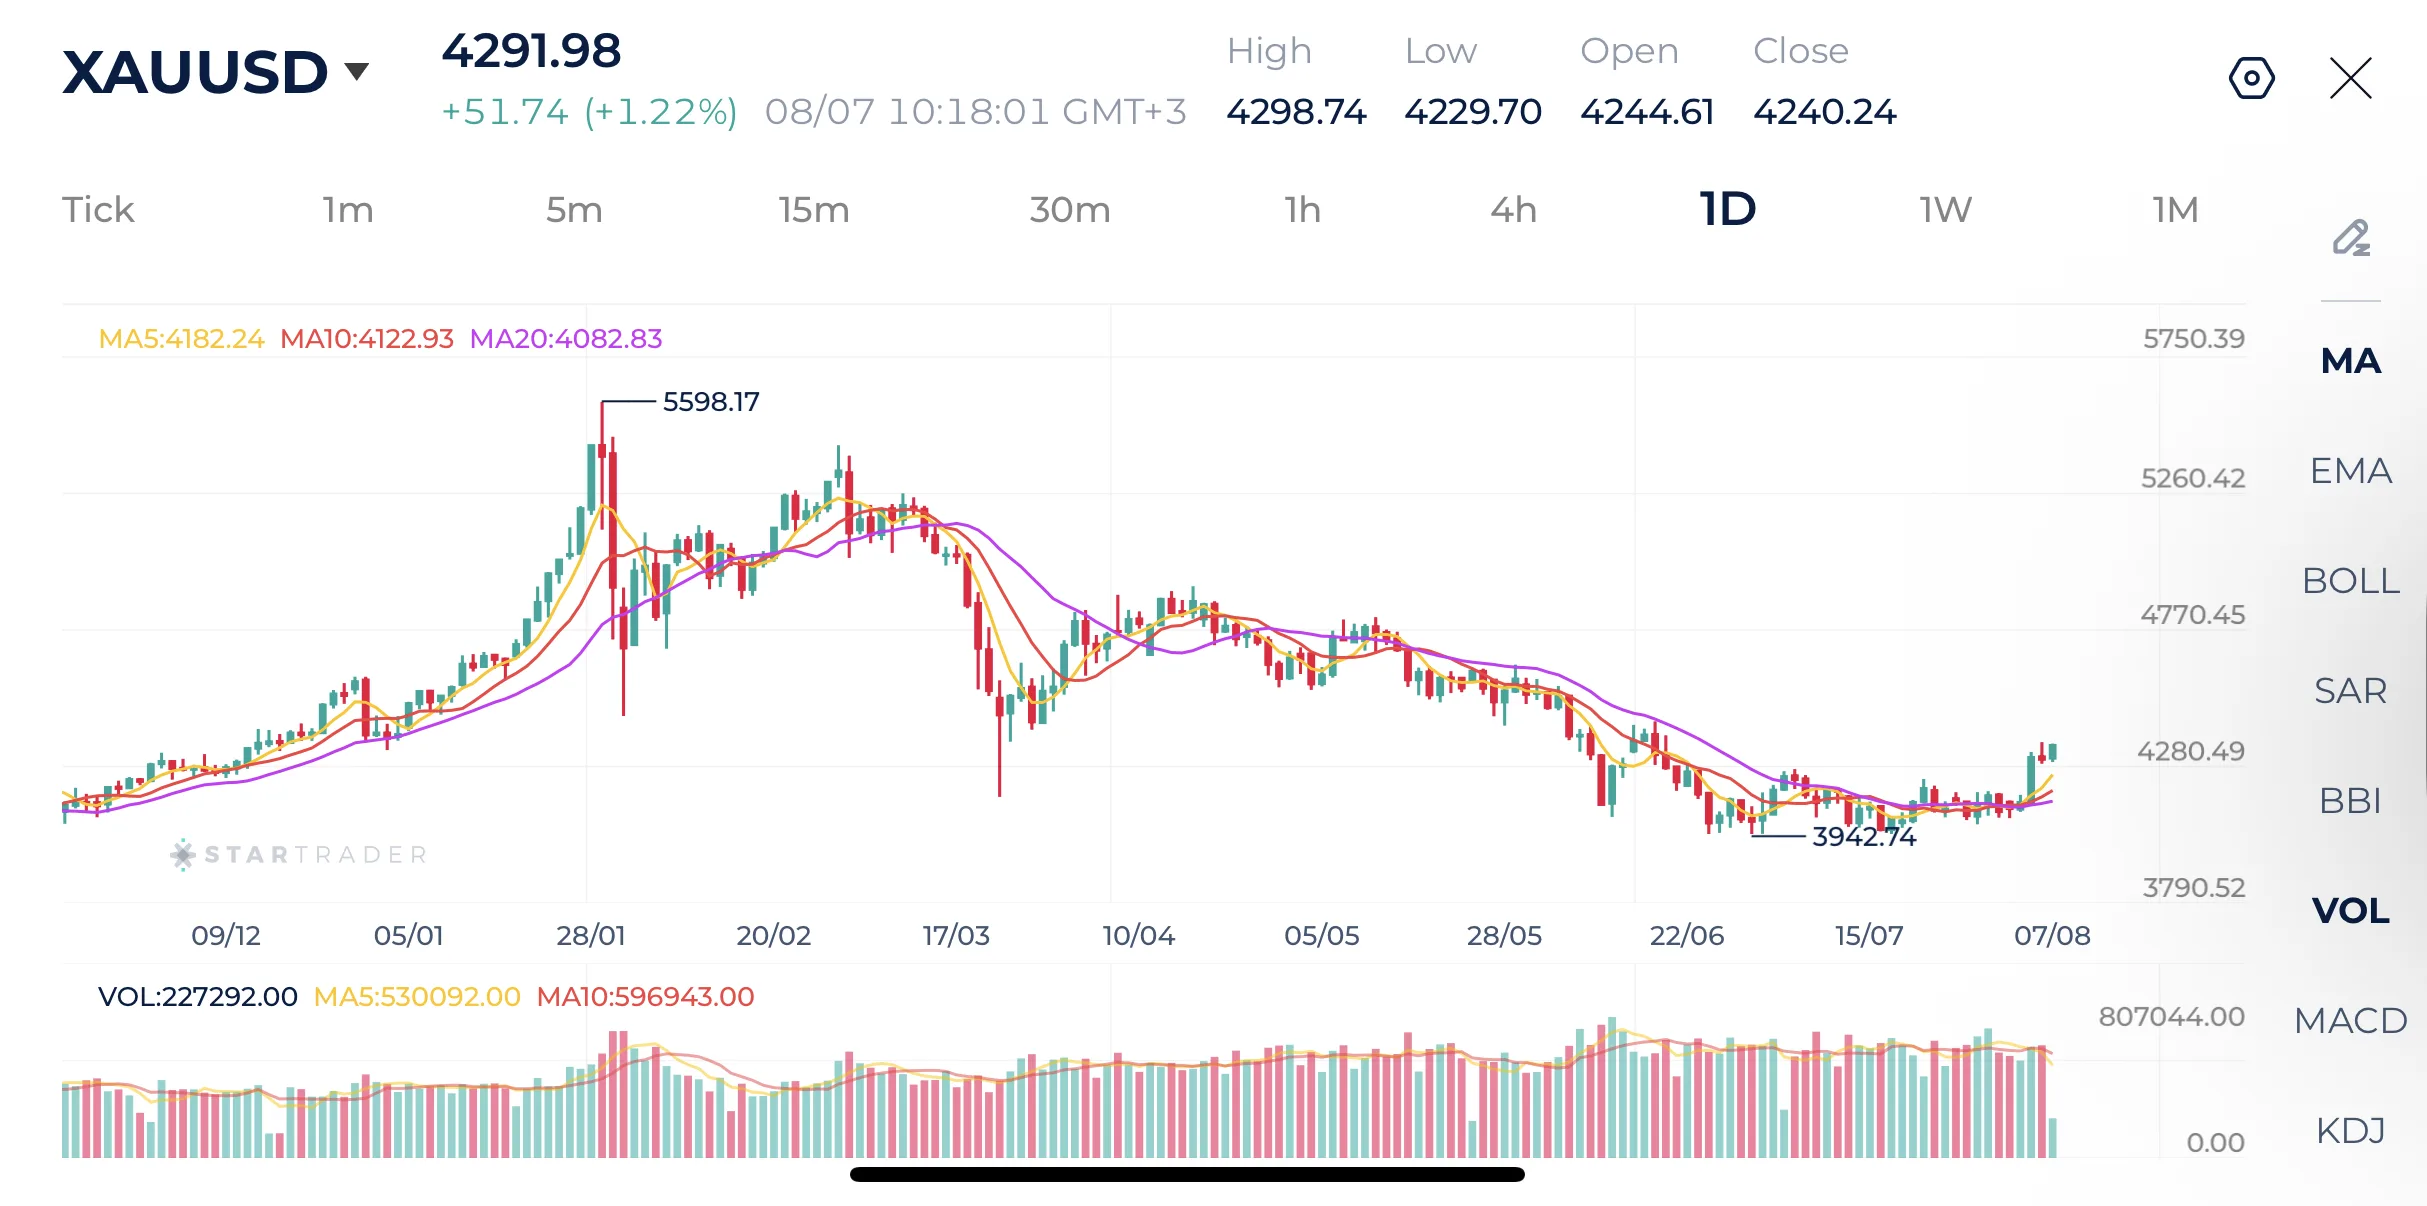
Source: STARTRADER app | Gold rebounds above $4,300 following weak employment numbers
| Resistance | $4,384 – $4,395 | $4,434 – $4,450 | $4,595 – $4,600 |
|---|---|---|---|
| Support | $4,173 – $4,190 | $4,075 – $4,090 | $3,942 – $3,950 |
Dow Jones Technical Analysis
The Dow Jones remains in a well-defined long-term uptrend, with price continuing to print higher highs and higher lows. The index recently reached a fresh record high around 54,800, confirming that buyers remain firmly in control.
Although the latest candles show some hesitation near all-time highs, the moving averages remain positively aligned, with the 5-day average above the 10-day and both comfortably above the rising 20-day average. This suggests that the current weakness is more likely a period of consolidation.
Bias remains Bullish while holding above 53,500. A sustained breakout above 54,800 would reinforce the broader uptrend.
Dow Jones Daily Chart
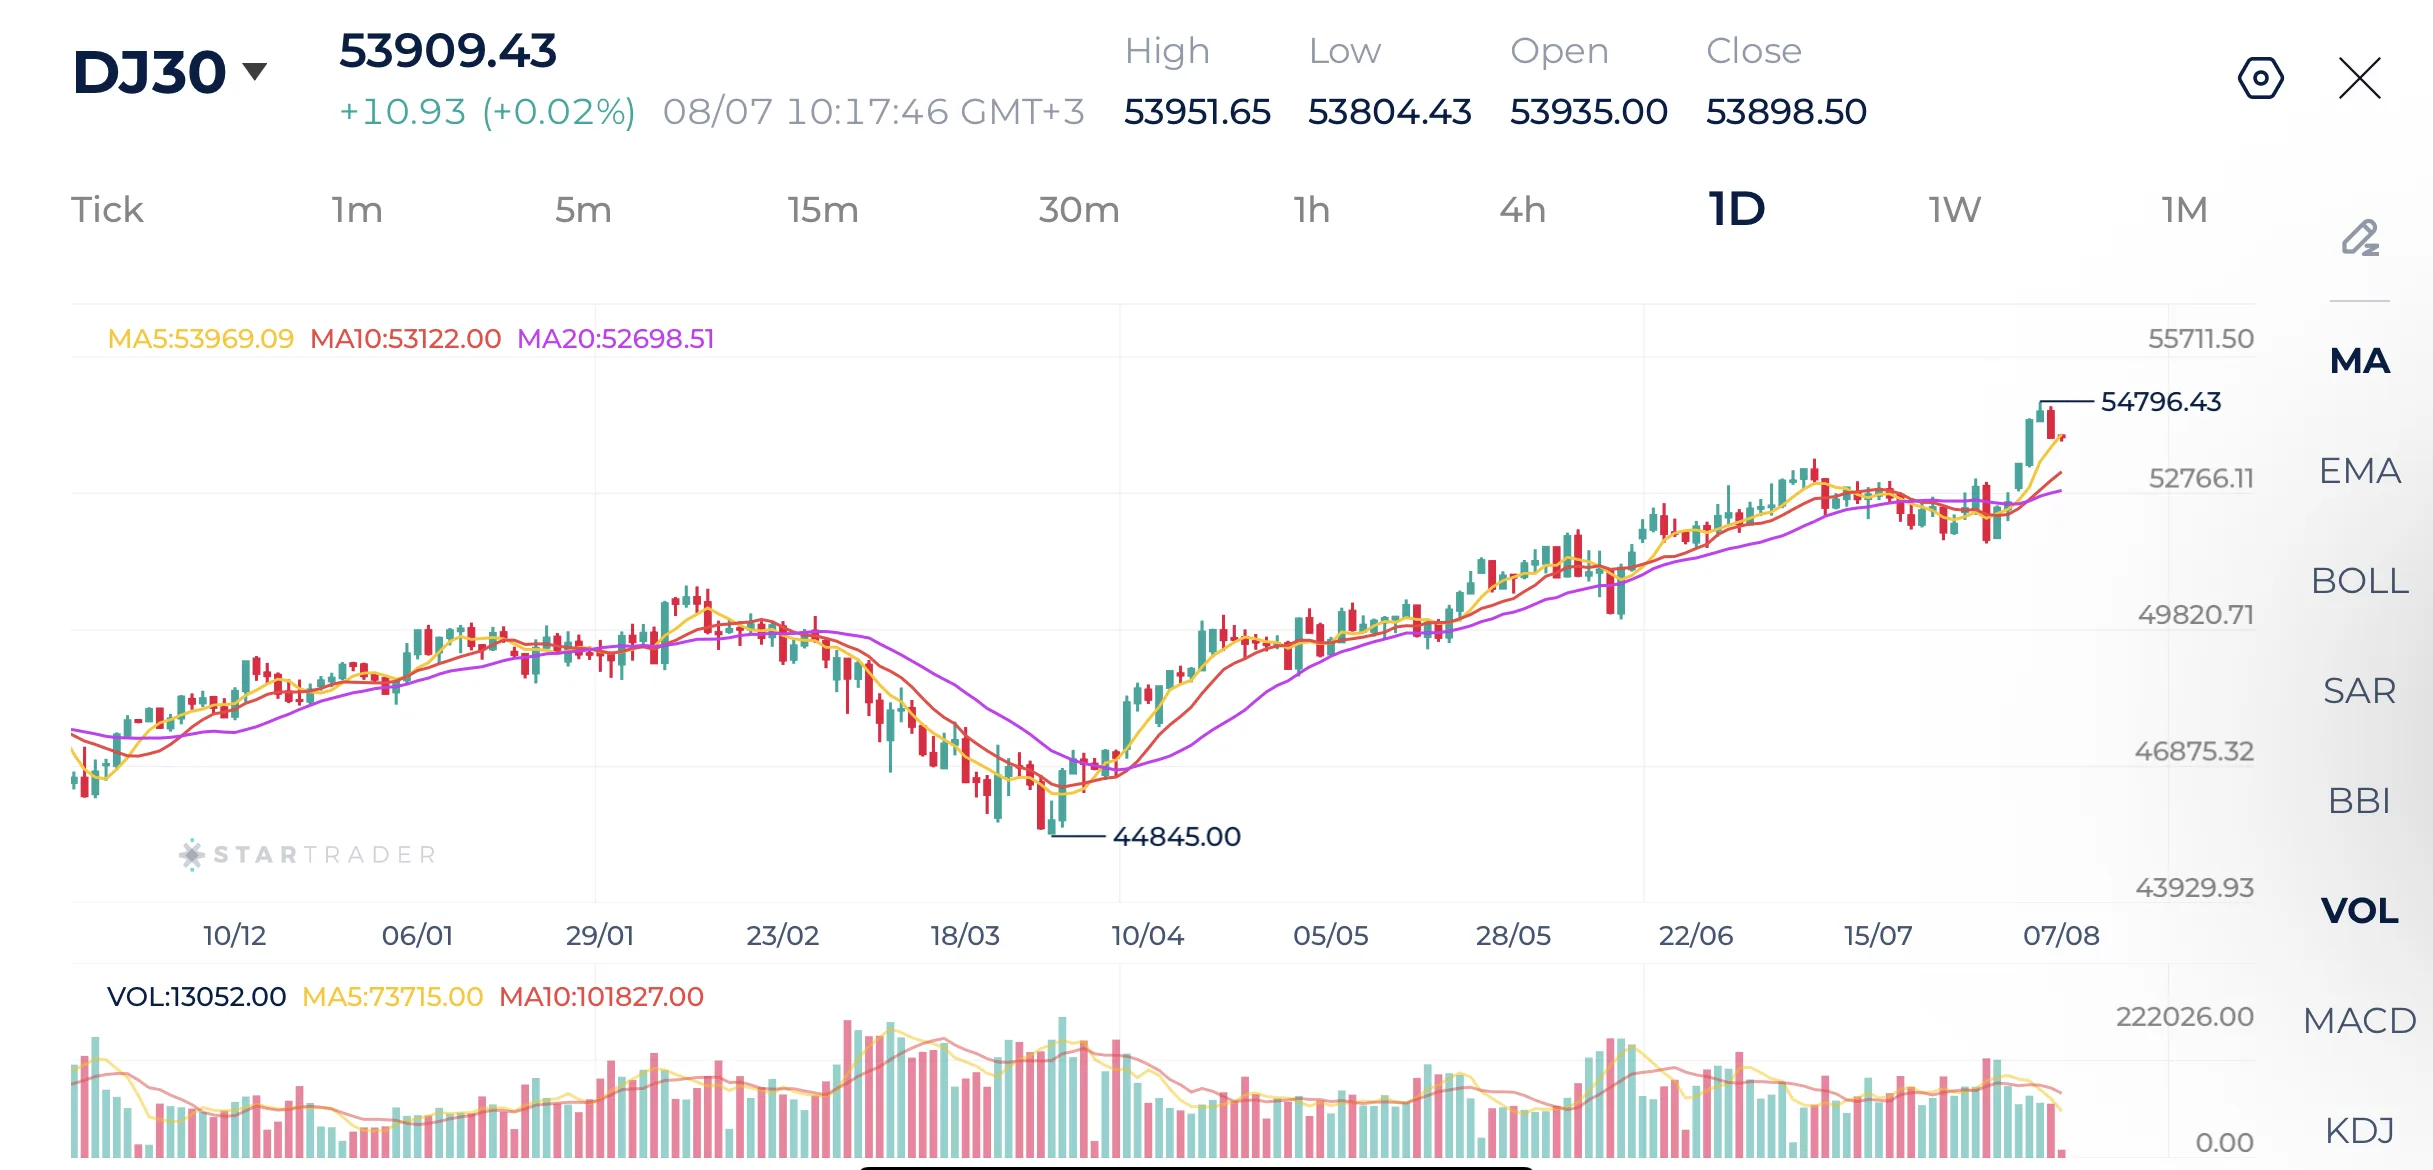
Source: STARTRADER app | Dow Jones breaks a new record high as investor optimism grows
| Resistance | 54,700 – 54,730 | 55,000 – 55,020 | 55,140 – 55,150 |
|---|---|---|---|
| Support | 53,373 – 53,390 | 52,305 – 52,320 | 51,510 – 51,520 |
Brent Technical Analysis
Brent crude remains under pressure following the failure to sustain gains above $90.00. And although a recovery developed from the June lows, the latest decline suggests bullish momentum is fading again.
Price has slipped below the 5-day and 10-day moving averages, while the 20-day moving average continues to trend lower, highlighting that the broader trend remains negative. The recent candles also show repeated rejection around the 90.00 region, reinforcing it as a significant resistance level.
Bias is neutral to bearish while below $90.00. A decisive break below $82.00 would strengthen downside momentum, whereas a recovery above $90.00 would be needed to signal a more meaningful trend reversal.
Brent Daily Chart
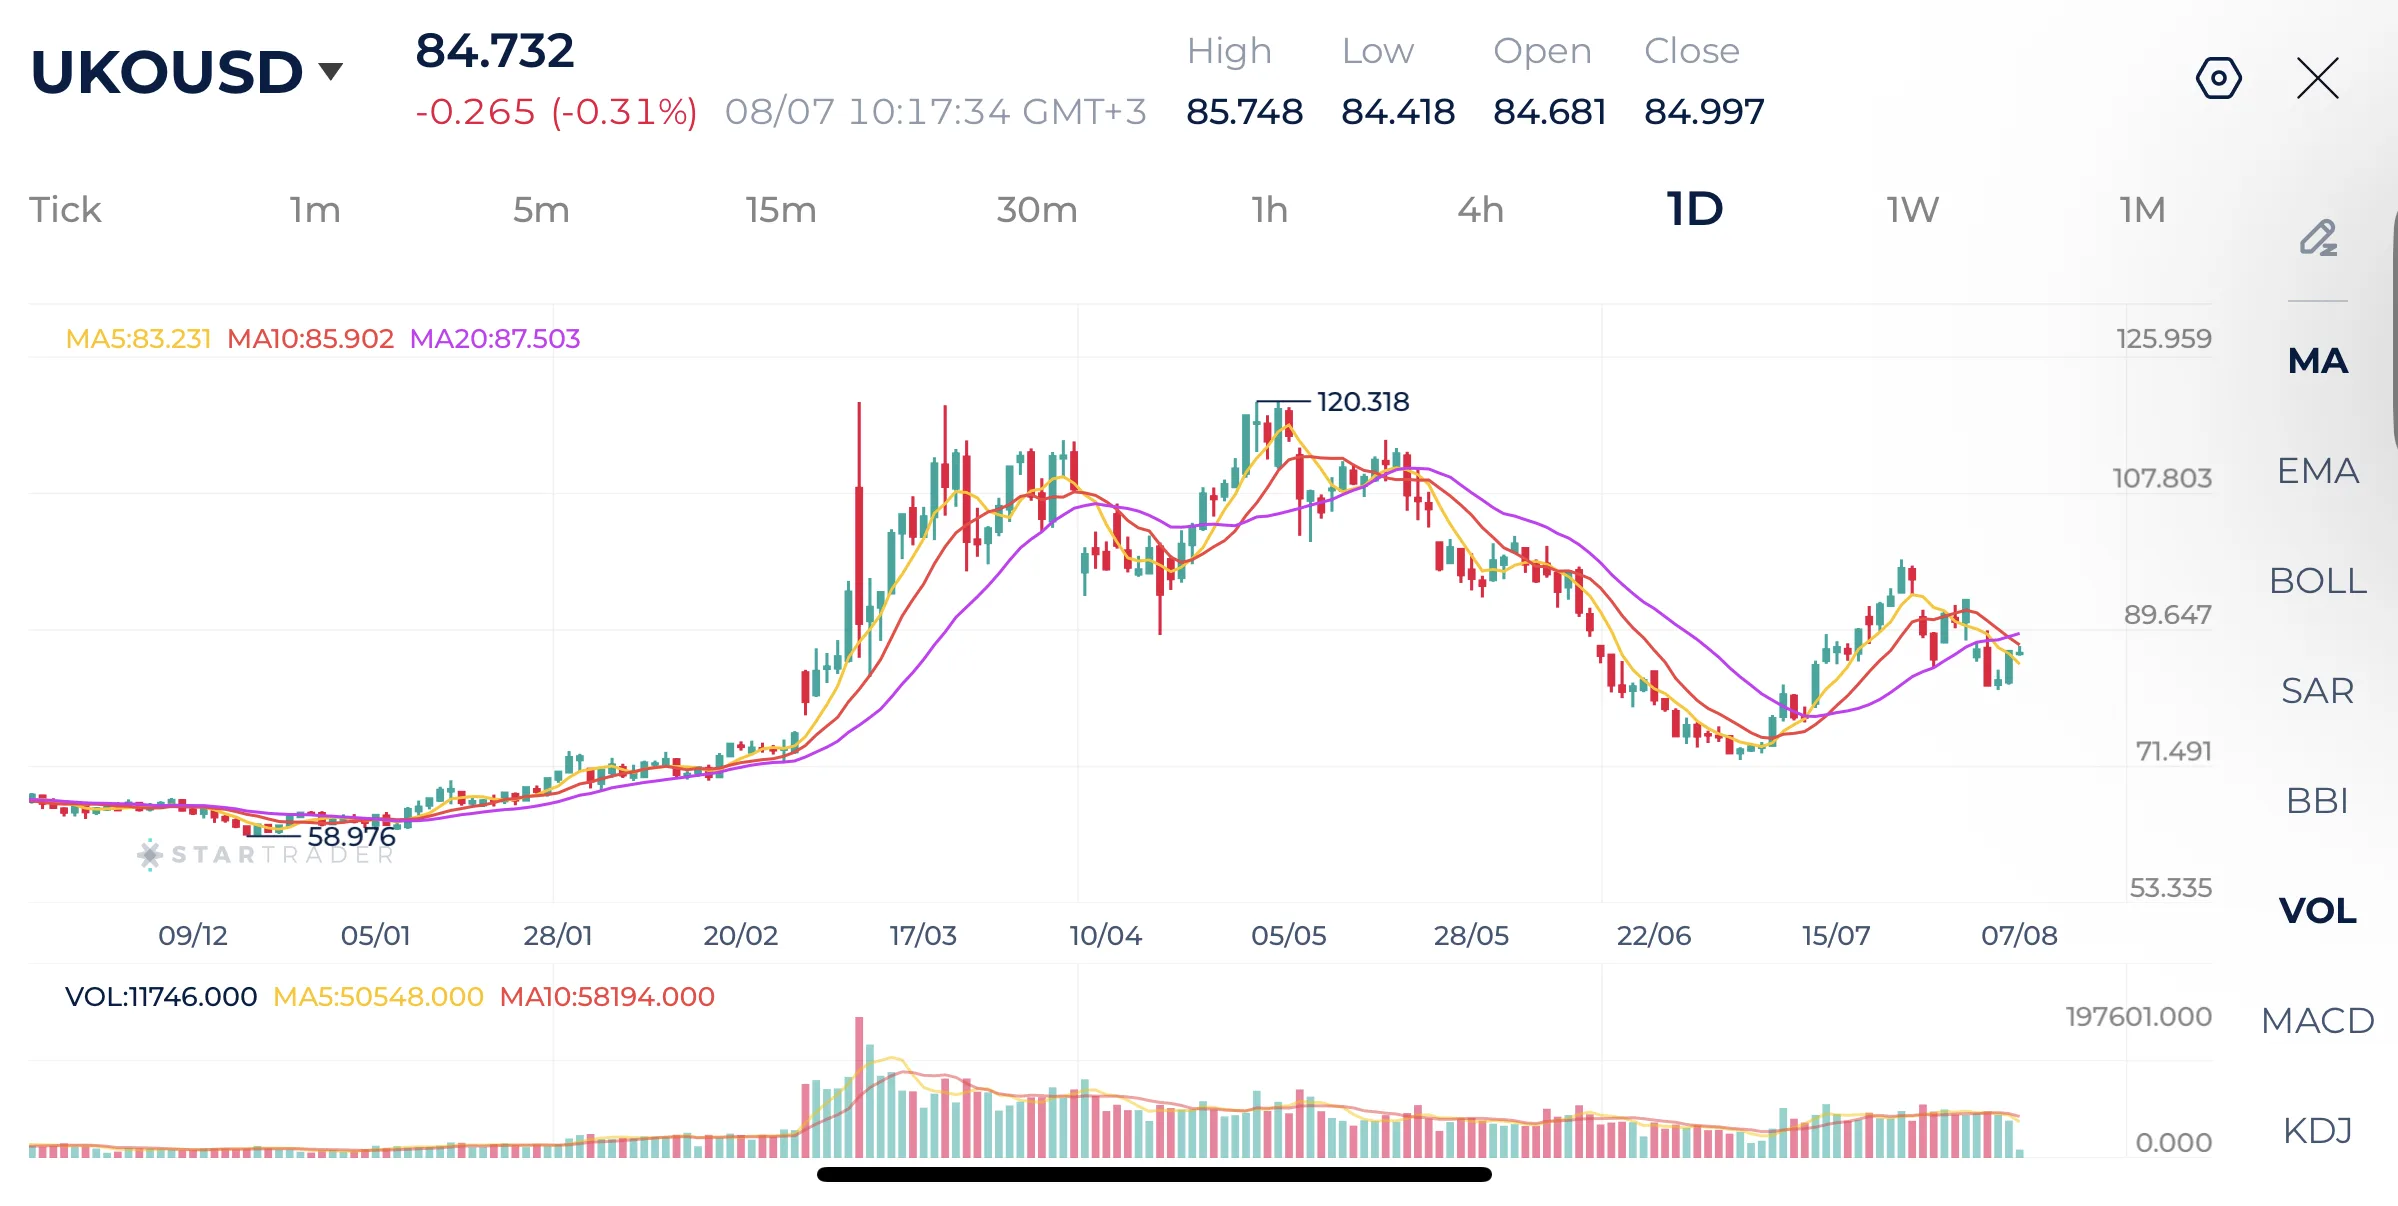
Source: STARTRADER app | Oil prices face pressure as brent falls below $80 a barrel
| Resistance | $90.00 – $90.20 | $91.64 – $91.75 | $93.80 – $93.90 |
|---|---|---|---|
| Support | $86.33 – $86.50 | $82.90 – $83.00 | $81.50 – $81.60 |
USDJPY Technical Analysis
USDJPY experienced a sharp bearish reversal after reaching a high near 164.00, breaking below all three major moving averages in one aggressive move. The selloff reflects a significant deterioration in bullish momentum and suggests that the longer-term uptrend has weakened considerably.
The pair is attempting to stabilize around 158.00, with a modest rebound underway. However, price remains below the downward-sloping 10-day and 20-day moving averages, indicating that sellers still have the upper hand. Any recovery toward these averages could attract renewed selling pressure unless buyers manage to reclaim them decisively.
Bias is bearish below 159.70. A break below 158.00 would increase the likelihood of another move toward 154.50, while recovery above 159.70 would improve the short-term outlook.
USDJPY Daily Chart
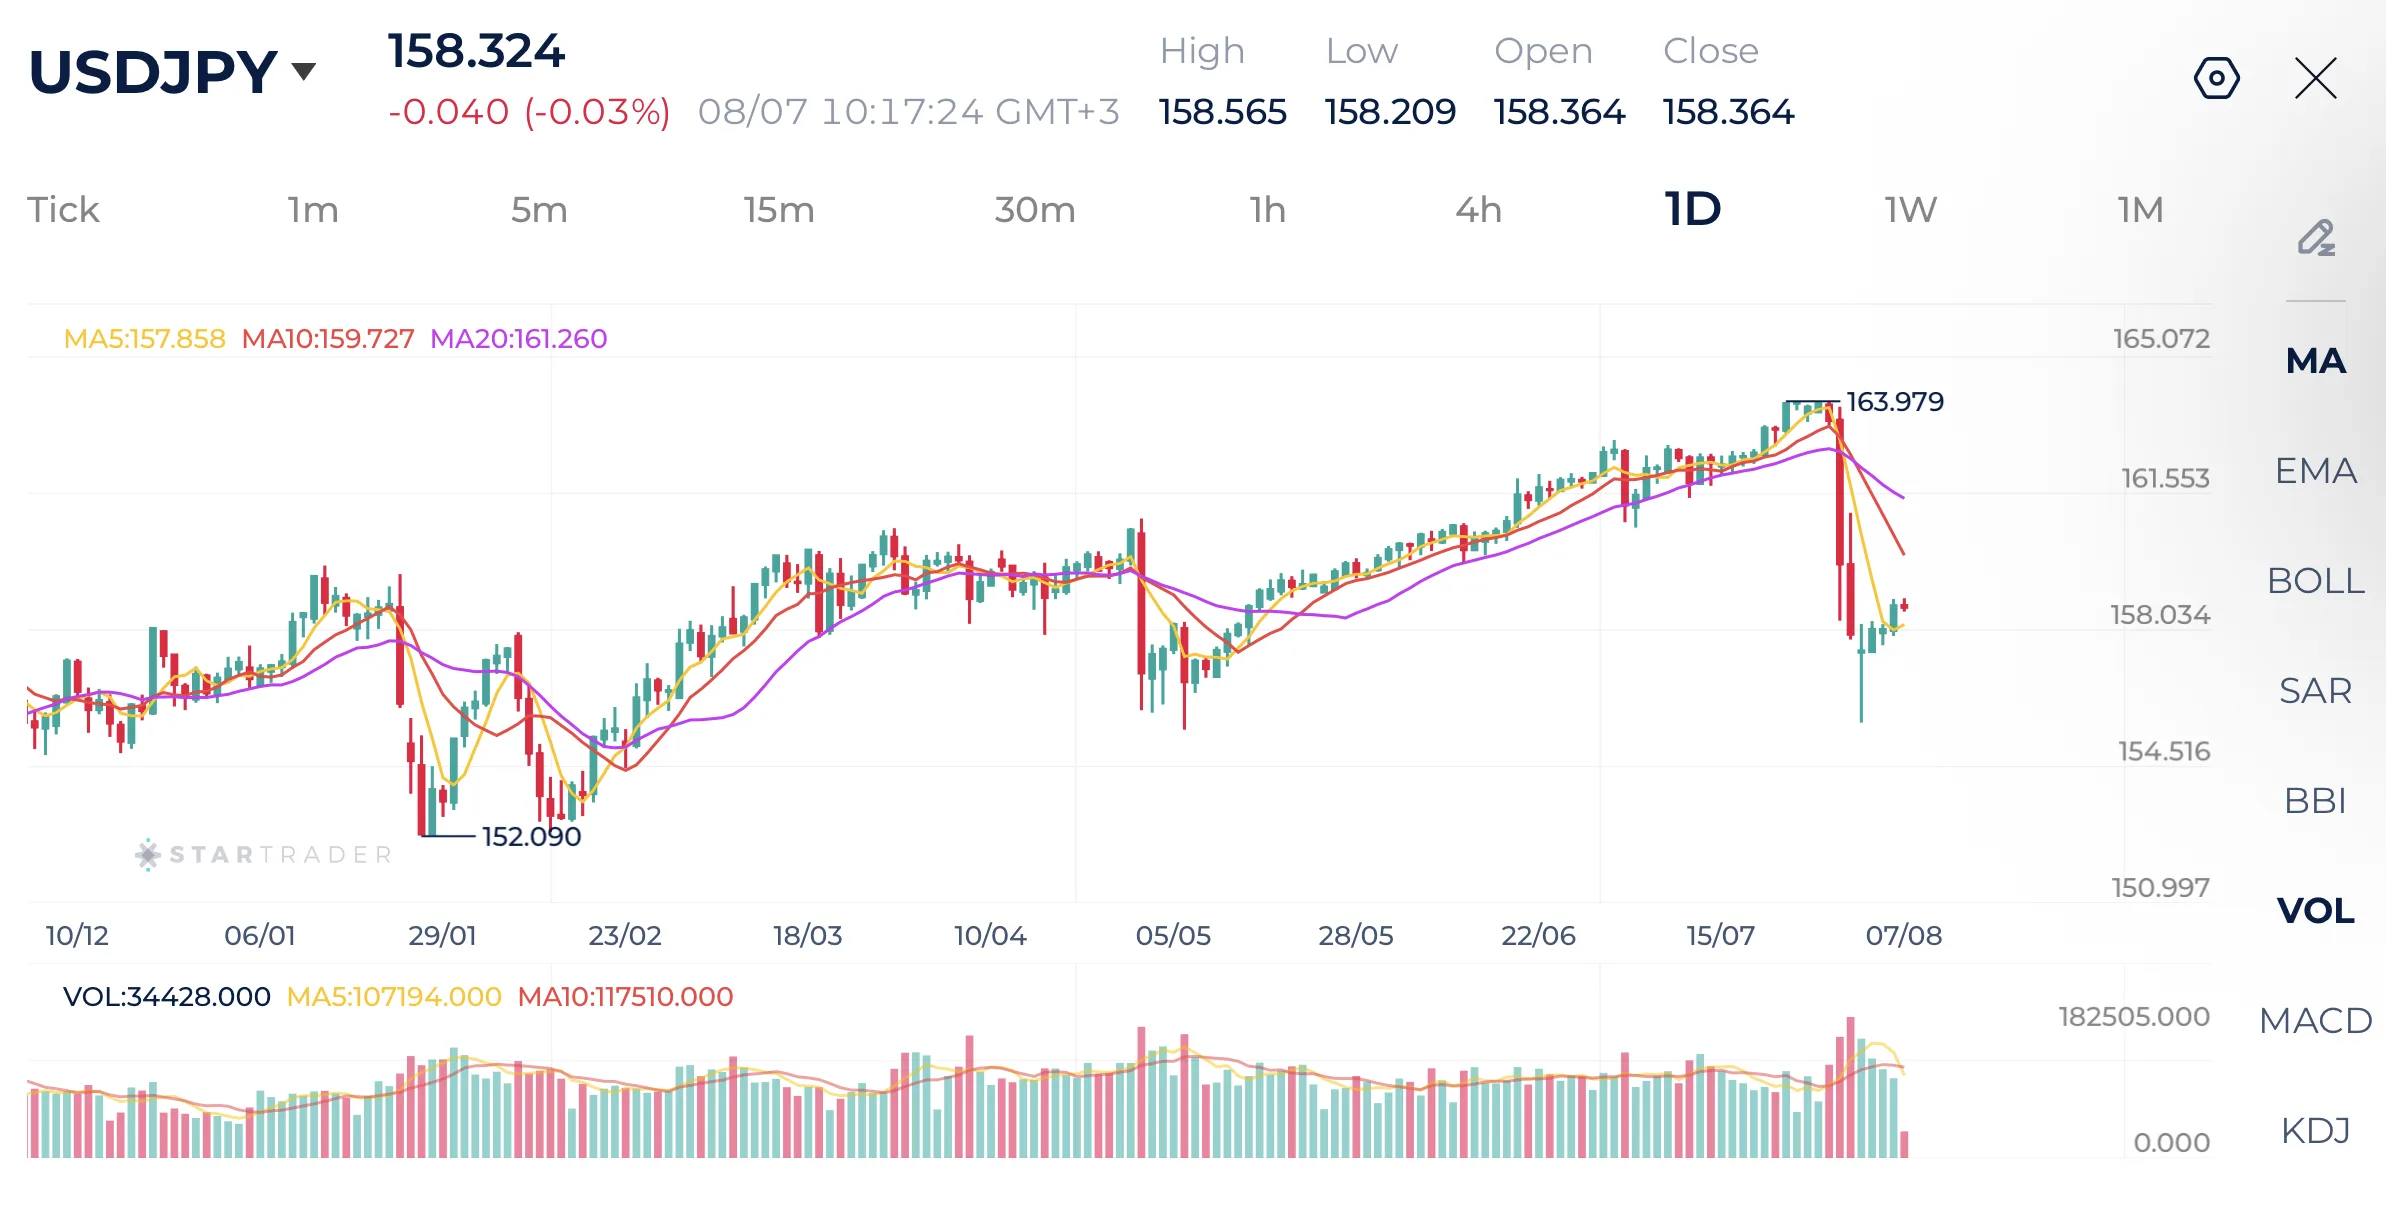
Source: STARTRADER app | The Japanese Yen falls slightly after a major spike last week
| Resistance | 158.90 – 159.00 | 159.63 – 159.80 | 160.53 – 160.70 |
|---|---|---|---|
| Support | 157.90 – 158.00 | 156.92 – 157.00 | 155.50 – 155.70 |
Risk Disclaimer: This material is provided for informational purposes only and does not constitute a recommendation or investment advice. Trading financial instruments on margin involves substantial risk and may not be appropriate for all investors.
Tags


Open Live Account
 Email Address
 Phone Number
Important Notice
STARTRADER does not accept any applications from Australian residents.
To comply with regulatory requirements, clicking the button will redirect you to the STARTRADER website operated by STARTRADER PRIME GLOBAL PTY LTD (ABN 65 156 005 668), an authorized Australian Financial Services Licence holder (AFSL no. 421210) regulated by the Australian Securities and Investments Commission.
Important Notice for Residents of the United Arab Emirates
In alignment with local regulatory requirements, individuals residing in the United Arab Emirates are requested to proceed via our dedicated regional platform at startrader.ae, which is operated by STARTRADER Global Financial Consultation & Financial Analysis L.L.C.. This entity is licensed by the UAE Capital Market Authority (CMA) under License No. 20200000241, and is authorised to introduce financial services and promote financial products in the UAE.
Please click the "Continue" button below to be redirected.


