








 Web Trader MT5













Key Takeaways
- Oil remained volatile: US-Iran tensions initially pushed crude higher before Saudi supply recovery eased pressure.
- Treasury yields surged: The 10-year yield topped 5.3%, while the 30-year moved above 5.6%, keeping financial conditions tight.
- Stocks proved resilient: Strong AI and technology demand helped equities absorb pressure from rising borrowing costs.
- Gold remained under pressure: Gold fell toward $4,110 as a stronger USD, elevated yields and Fed hike expectations weighed on demand.
- US inflation softened: Core PCE rose 3.0% YoY, below expectations, reducing near-term expectations for an October Fed hike.
- US growth remained resilient: Q2 GDP grew 2.2%, while ADP employment rose by 90,000, supporting the view of a still-resilient economy.
- Next week’s focus: Markets will watch US labor data, Fed expectations, Treasury yields and oil developments for the next major market direction.
US Bond Yields Jump to Their Highest Levels Since 2002
The bond market remained one of the biggest stories of the week. US Treasury yields climbed to their highest levels in years, with the 10-year yield briefly exceeding 5.3% and the 30-year yield moving above 5.6%, reflecting concerns over persistent inflation, higher oil prices, strong economic growth and the possibility of additional Fed tightening.
Despite the sharp rise in borrowing costs, US equities proved relatively resilient. The Nasdaq continued to benefit from strength in technology and AI-related stocks, while the broader market was more sensitive to rising yields. The week highlighted an important market dynamic: strong corporate earnings and AI demand have so far helped absorb some of the pressure created by higher interest rates, although sustained increases in long-term yields could eventually put greater pressure on equity valuations.
Gold Remains Under Pressure Due to Rate Hike Expectations
Gold had a difficult week, falling sharply toward $4,110, its lowest level since early August, before stabilizing around the $4,150–$4,200 area. The initial sell-off was driven by the combination of higher oil prices, a stronger US dollar and rising Treasury yields, which increased the opportunity cost of holding the non-yielding metal.
The picture briefly improved after softer-than-expected US inflation data reduced expectations for an October Fed hike. However, stronger US growth and employment data, together with elevated long-term yields, limited the recovery. Gold, therefore, remains highly sensitive to the USD Treasury yield and Fed expectations relationship.
US Economic Data Dominated Market Sentiment
The economic calendar provided mixed signals. August PCE inflation was softer than expected, with core PCE rising 3.0% year-on-year, reducing near-term expectations for another Fed rate hike. Markets subsequently reduced the probability of an October hike to around the high 40% from above 70% earlier in the week.
At the same time, the US economy remained relatively resilient. The third estimate for Q2 GDP showed 2.2% annualized growth, while August ADP private employment increased by 90,000. Initial jobless claims also remained low at 197,000, reinforcing the picture of a labour market that is cooling but not deteriorating sharply.
Outlook for Next Week: 5–9 October
The key theme for next week will be whether the market continues to move toward lower expectations for Fed tightening, or whether strong economic data and higher oil prices revive the case for another rate increase.
- Treasury yields will remain critical. With the 10-year yield above 5% and the 30-year above 5.6%, the bond market has become one of the most important drivers of equity valuations. A stabilization or decline in yields could provide relief for stocks, while another sharp move higher could increase pressure on equities.
- Oil remains the major inflation wildcard. Further progress in US-Iran negotiations and continued recovery of Saudi exports could reduce the geopolitical premium in crude. However, renewed disruption around the Strait of Hormuz or regional energy infrastructure could push oil higher again, potentially complicating the Fed’s inflation outlook.
- Gold needs a break in the USD–yield relationship. After falling toward $4,110, gold’s next major moves will likely depend on whether Treasury yields and the dollar continue higher. A softer dollar and lower yields could allow gold to recover, while sustained high yields would keep the metal under pressure.
- Stocks enter October with a relatively resilient backdrop but elevated risks. AI and technology strength continues to provide support, but the combination of expensive oil, very high Treasury yields and uncertainty over Fed policy creates a challenging macro backdrop. The key question for October will be whether corporate earnings and AI investment can continue to offset the pressure from higher borrowing costs.
Major Economic Calendar Events for the Upcoming Week
| Date | Metric | Country | Previous | Time [Dubai] |
|---|---|---|---|---|
| Monday, 5 October | ISM Services PMI | USA | 55.4 | 6:00 PM |
| Tuesday, 6 October | Ivey PMI | Canada | 64.3 | 6:00 PM |
| Wednesday, 7 October | FOMC Meeting Minutes | USA | 10:00 PM | |
| Thursday, 8 October | Unemployment Claims | USA | 4:30 PM | |
| Friday, 9 October | Employment Change | Canada | -41.7K | 4:30 PM |
| Friday, 9 October | Unemployment Rate | Canada | 6.4% | 4:30 PM |
Technical Analysis and Forecast:
Gold Technical Analysis
Gold remains under significant technical pressure, trading around $4,187 after the sharp decline from its record high near $4,697. Price is below the 10-day and 20-day moving averages, although it is attempting to stabilize following the recent sell-off.
Immediate resistance is around $4,196, followed by $4,289–$4,320. Support is around $4,134–$4,110, with the recent low at $4,110.86.
The broader price action shows that the previous bullish trend has weakened considerably. The current rebound remains relatively modest, so a break above $4,196 would be important for improving the short-term structure. Conversely, a break below $4,110 could expose gold to further downside.
Gold Daily Chart
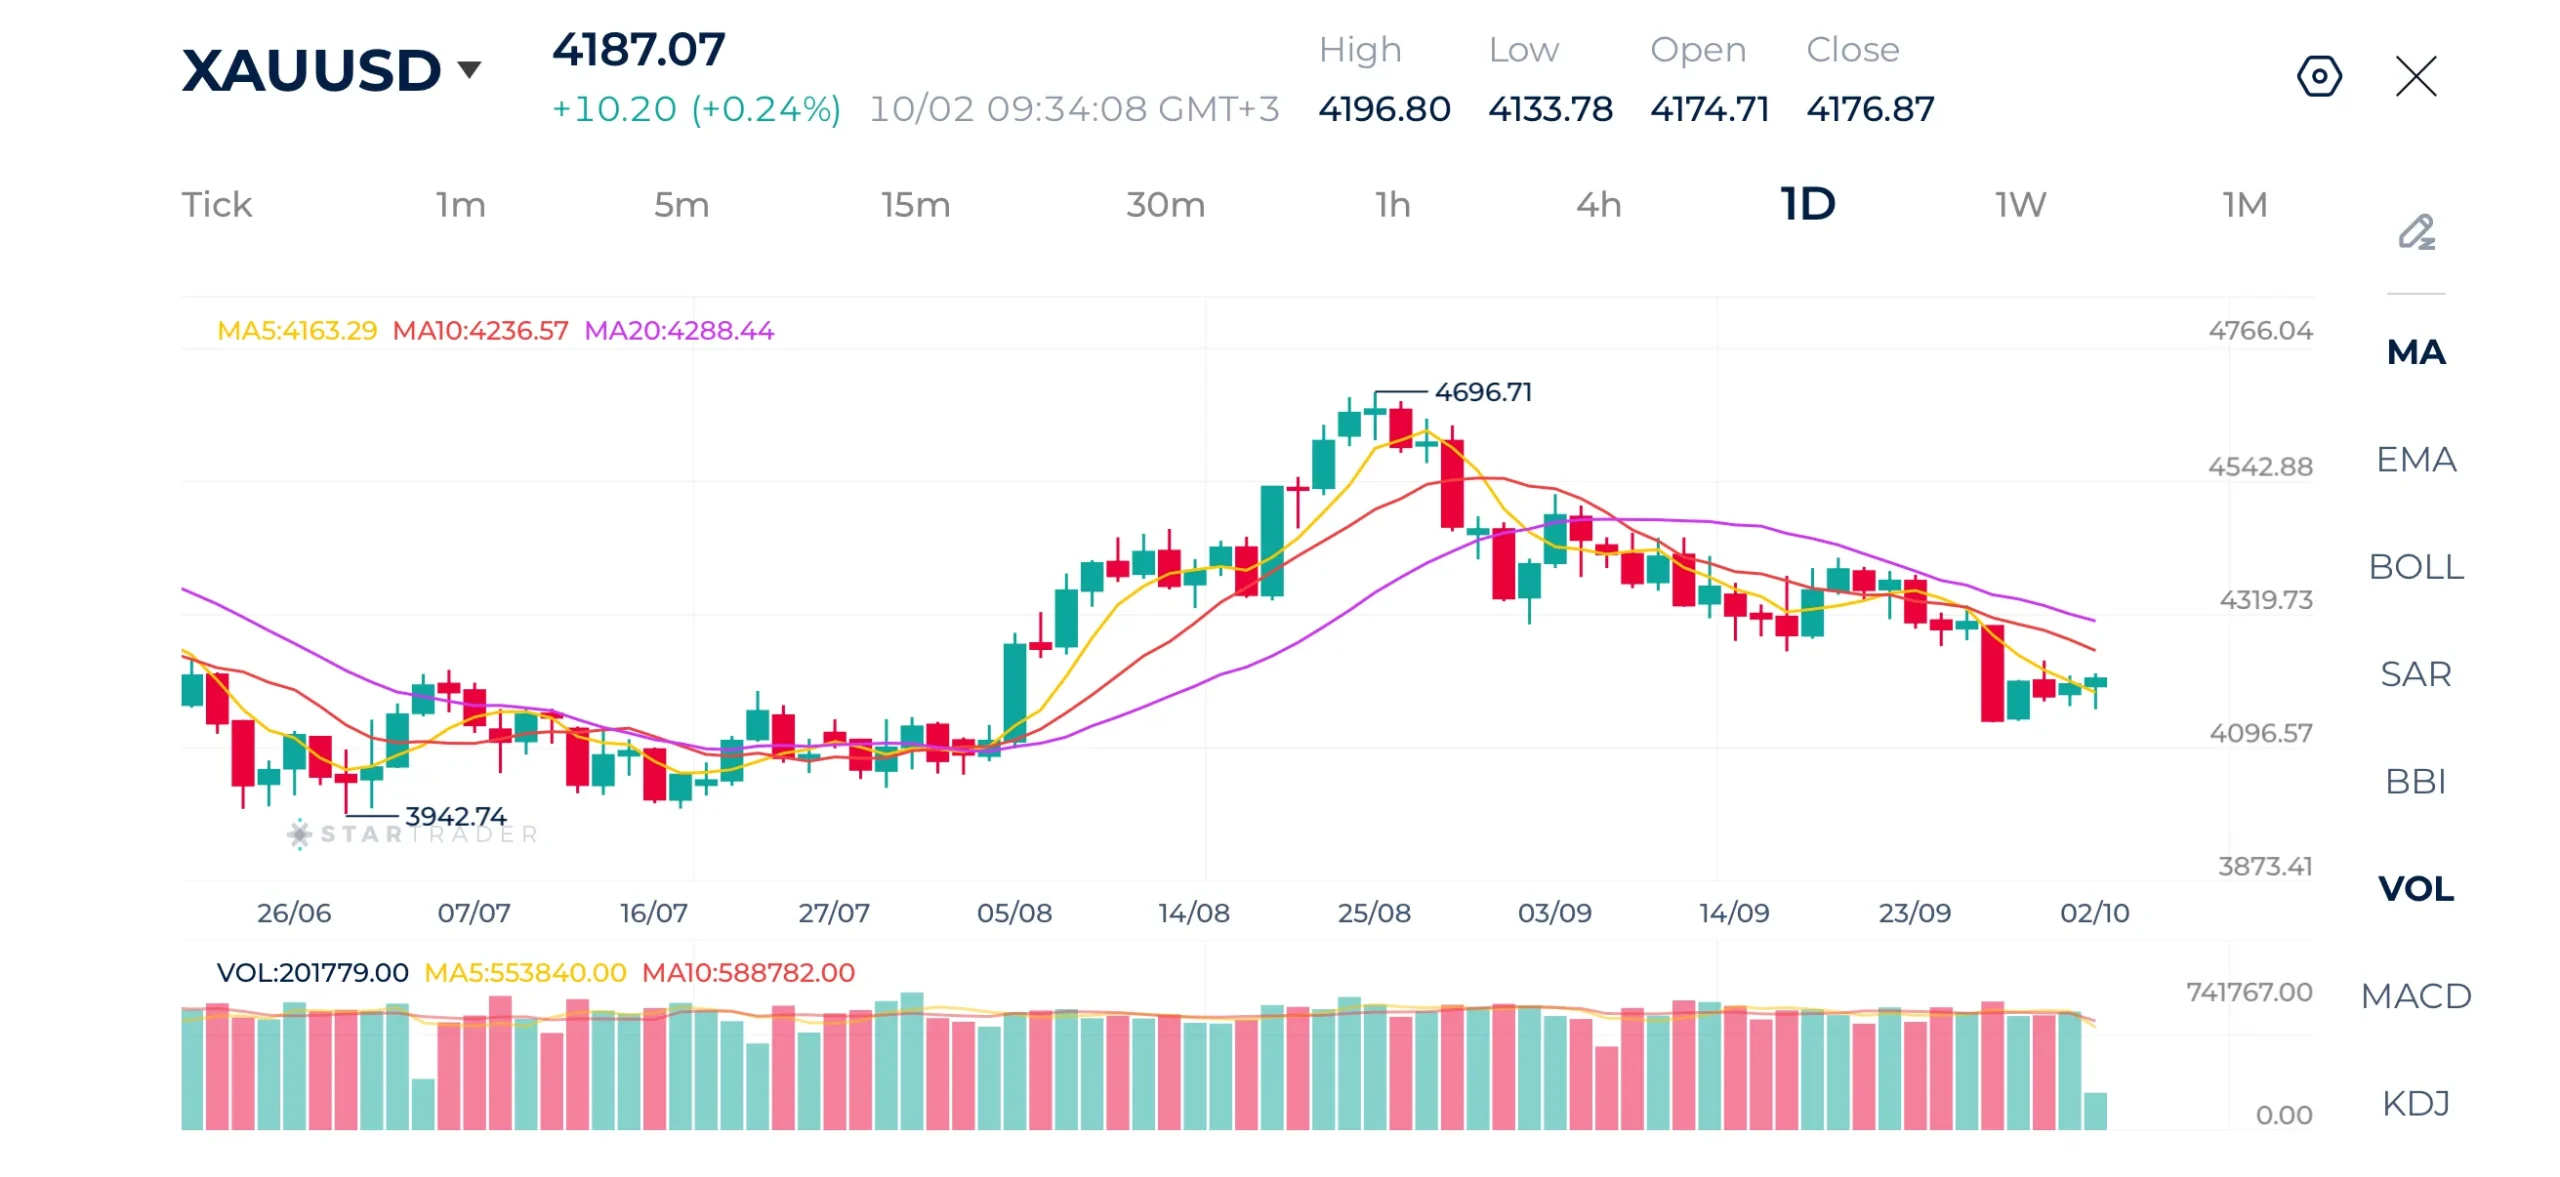
Source: STARTRAER app | Gold remains under perssure due to a stronger dollar and rising yields
| Resistance | $4,220 – $4,225 | $4,318 – $4,325 | $4,400 – $4,412 |
|---|---|---|---|
| Support | $4,112 – $4,120 | $4,050 – $4,060 | $3,997 – $4,000 |
WTI Technical Analysis
West Texas Intermediate is showing a short-term corrective phase within a broader recovery, trading around $94.34 after pulling back from the recent high of $106.75. Price is currently below the 5-day, 10-day, and 20-day moving averages, indicating weakening short-term momentum.
Immediate resistance is around $95.00–$97.50, followed by $98.70 and the recent high near $106.75. Support is around $94.25, followed by $92.00 and $87.08.
The recent price action suggests consolidation after the strong September rally. Holding above $94 could allow a recovery toward $97–98, while a sustained break below $94 would increase the risk of a deeper correction toward the $92–87 zone.
WTI Daily Chart
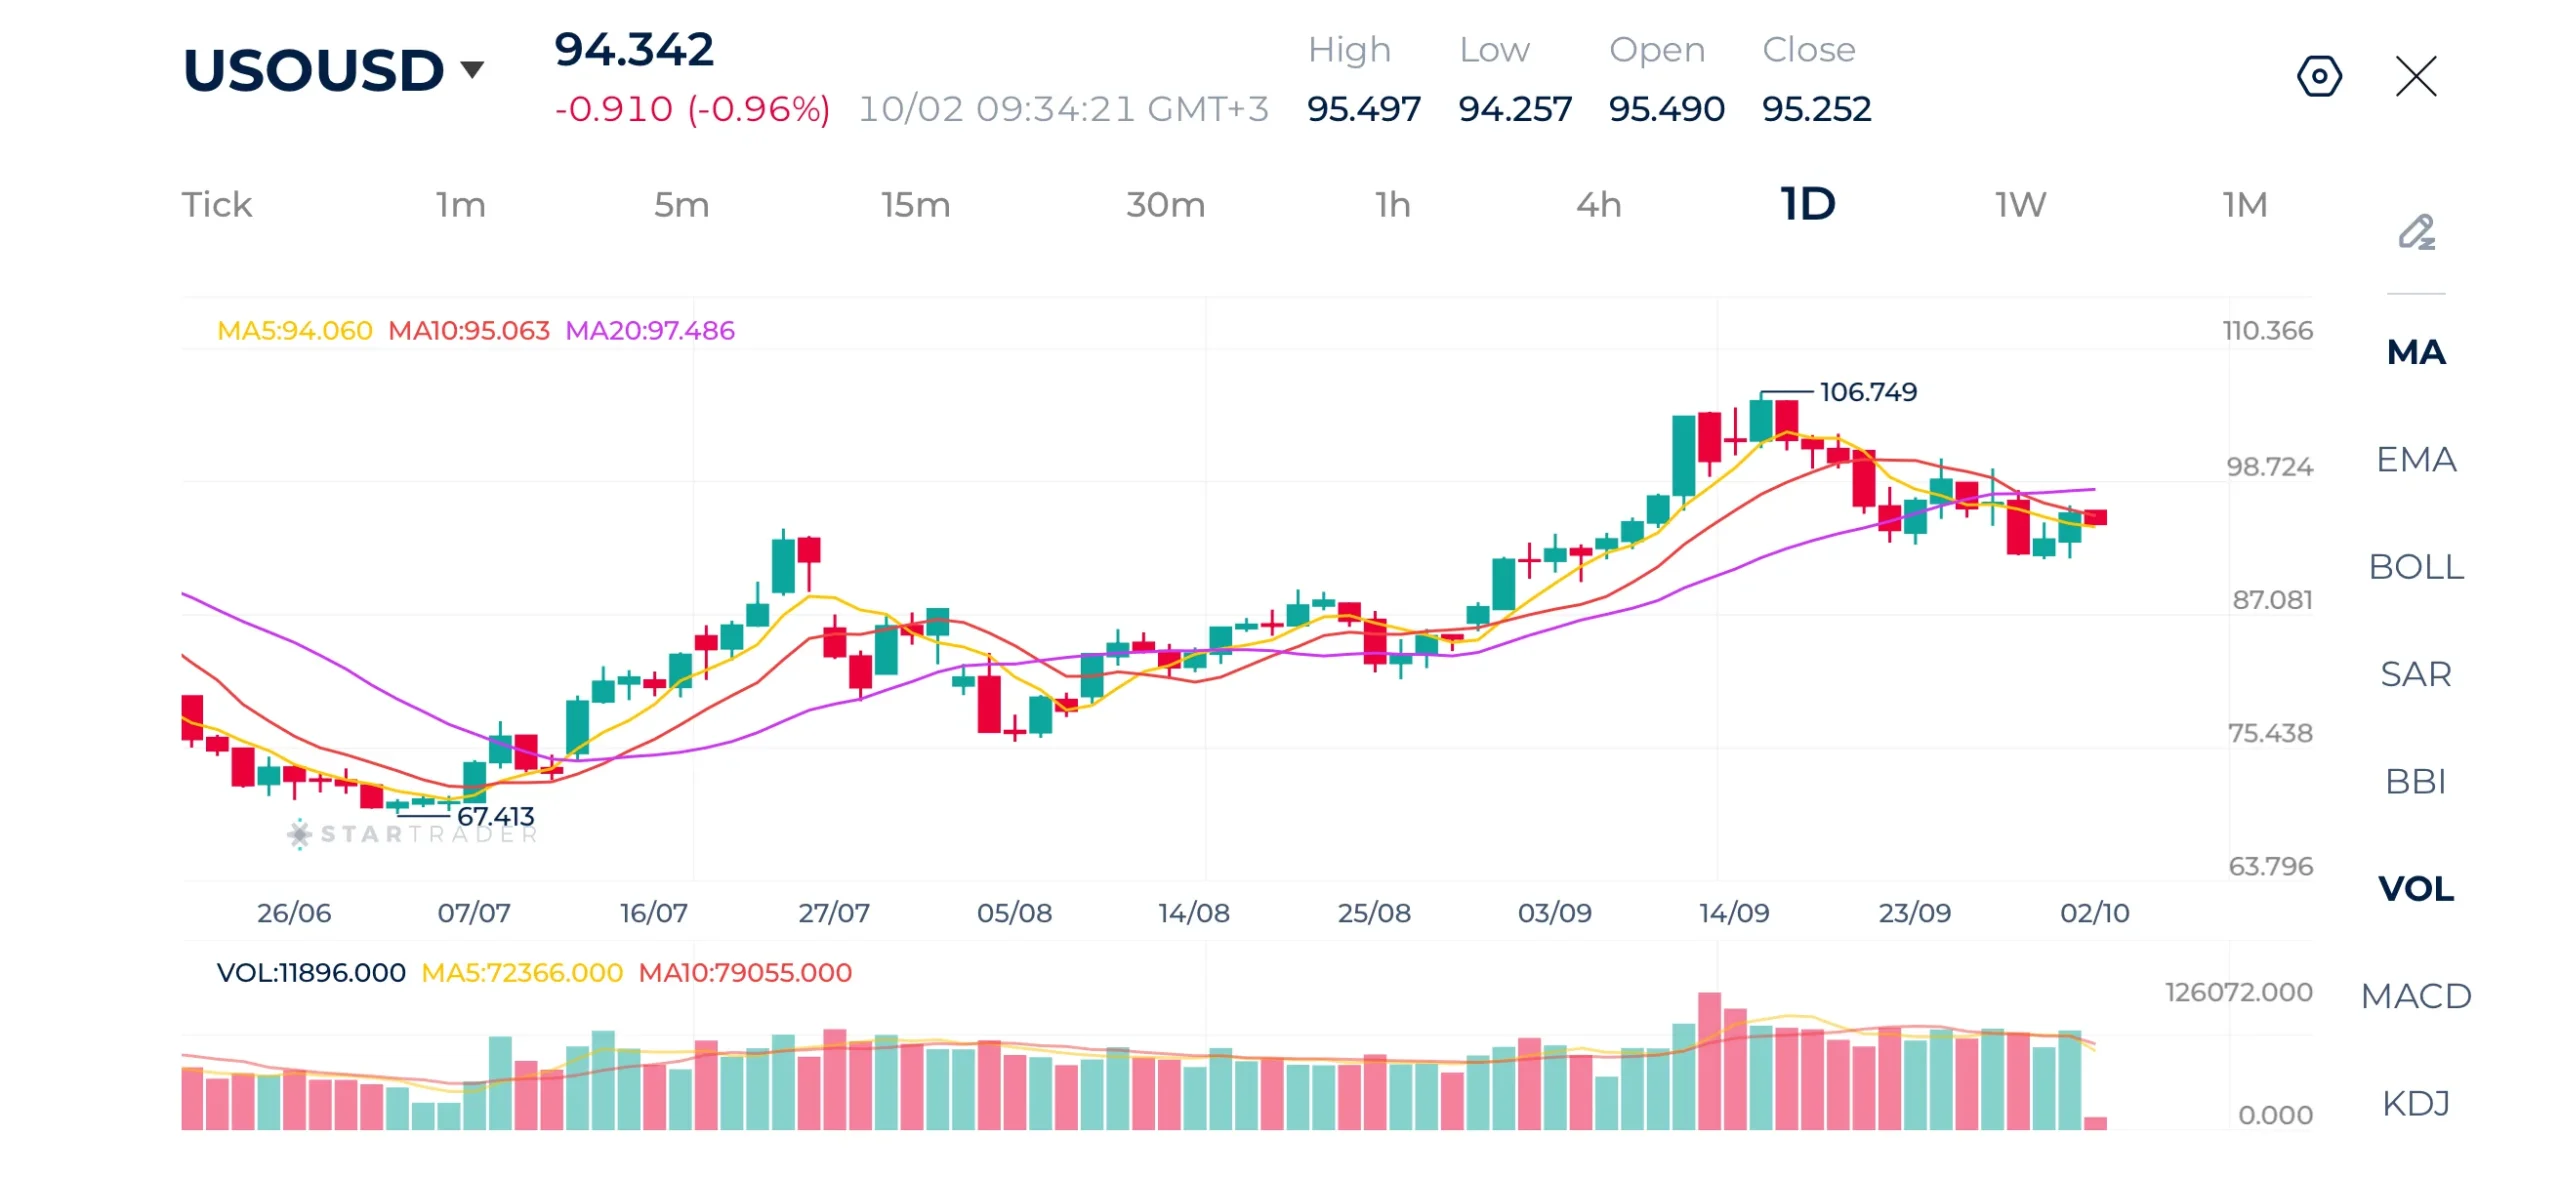
Source: STARTRADER app | Oil prices remain elevated due to limited energy supplies
| Resistance | $97.50 – $97.64 | $98.70 – $98.80 | $100.00 – $100.24 |
|---|---|---|---|
| Support | $94.25 – $94.30 | $92.00 – $92.21 | $90.00 – $90.12 |
Nasdaq Technical Analysis
Nasdaq 100 remains in a strong bullish trend, trading around 30,642 and holding close to its recent record high of 30,924. Price remains comfortably above the three daily moving averages MA5, MA10 and MA20, with all three averages maintaining a bullish configuration.
Immediate resistance is at 30,924, followed by the psychological 31,000 level. Support is around 30,540, followed by 30,140 and the MA20 near 29,942.
The overall structure remains bullish, although the index is consolidating near its highs after the recent strong rally. A sustained break above 30,924–31,000 would reinforce the upward momentum, while a break below 30,540 could trigger a deeper correction.
Nasdaq Daily Chart
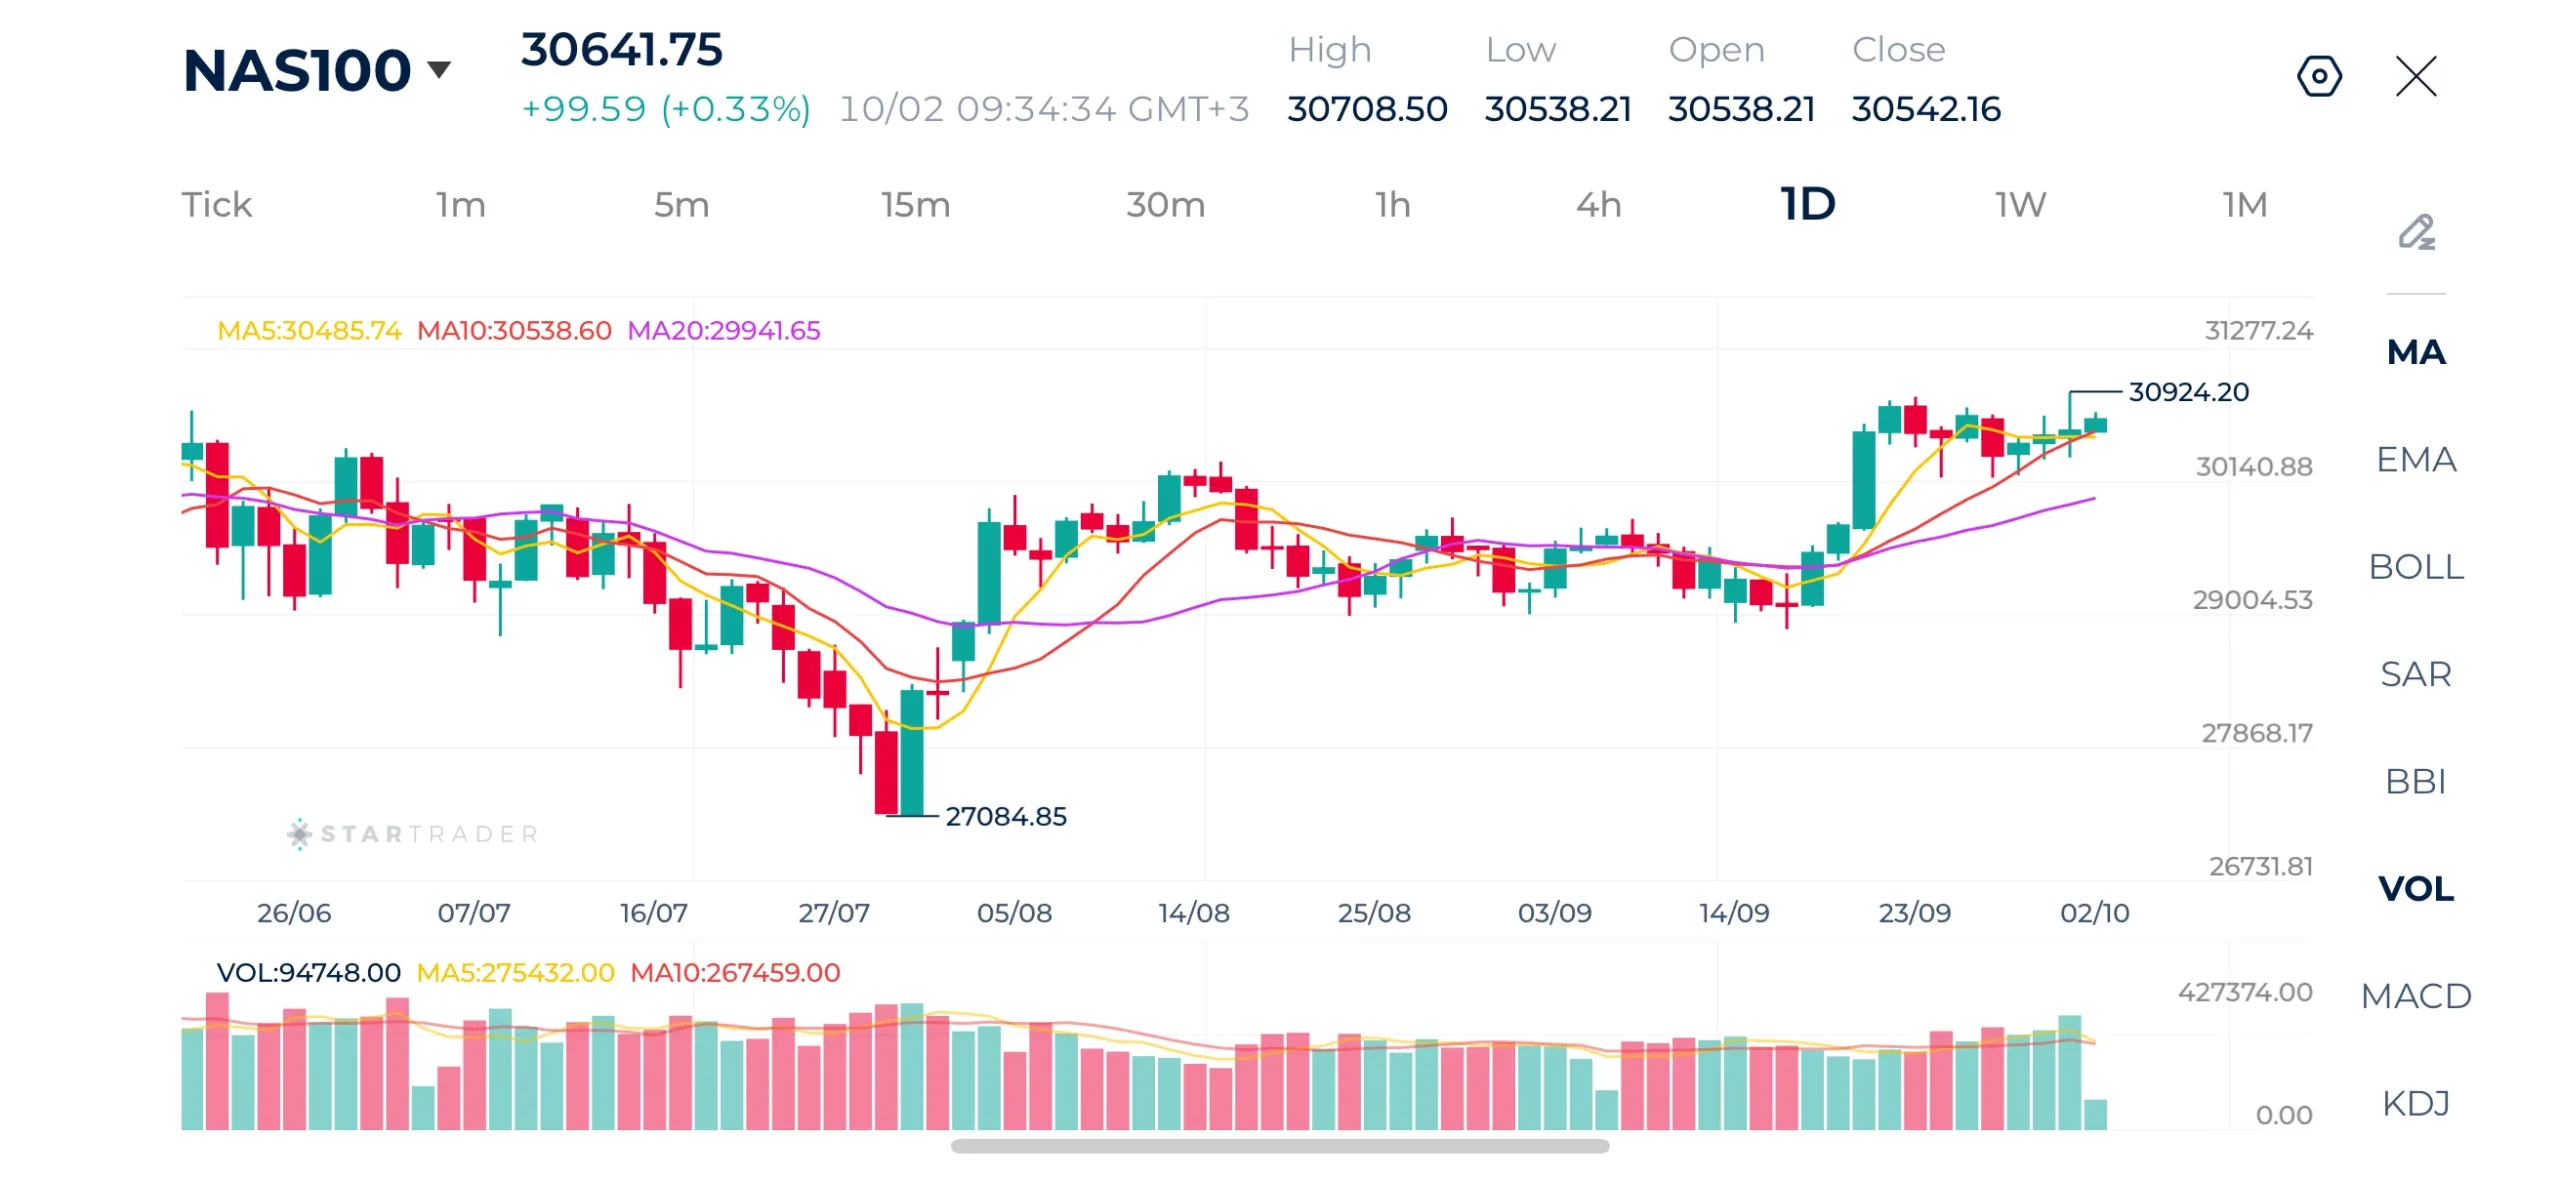
Source: STARTRADER app | Nasdaq reaches a new record high despite higher yields
| Resistance | 30,924 – 30,940 | 31,000 – 31,042 | 31,214 – 31,225 |
|---|---|---|---|
| Support | 30,540 – 30,553 | 30,140 – 30,166 | 29,942 – 29,955 |
USDJPY Technical Analysis
USDJPY is showing a mixed to bearish short term structure, trading around 157.71 after pulling back from the recent recovery toward 158.50. Price is currently around the MA5 and below the MA10, while the MA20 remains lower at 156.25.
Immediate resistance is around 158.20–158.50, followed by the recent high near 158.90. Support is around 157.50, followed by 156.85 and the stronger support zone near 156.25.
The recent candles suggest consolidation after the earlier rebound. A break above 158.50 could revive the bullish momentum, while a move below 157.50 would increase the risk of a deeper pullback toward 156.85–156.25.
USDJPY Daily Chart
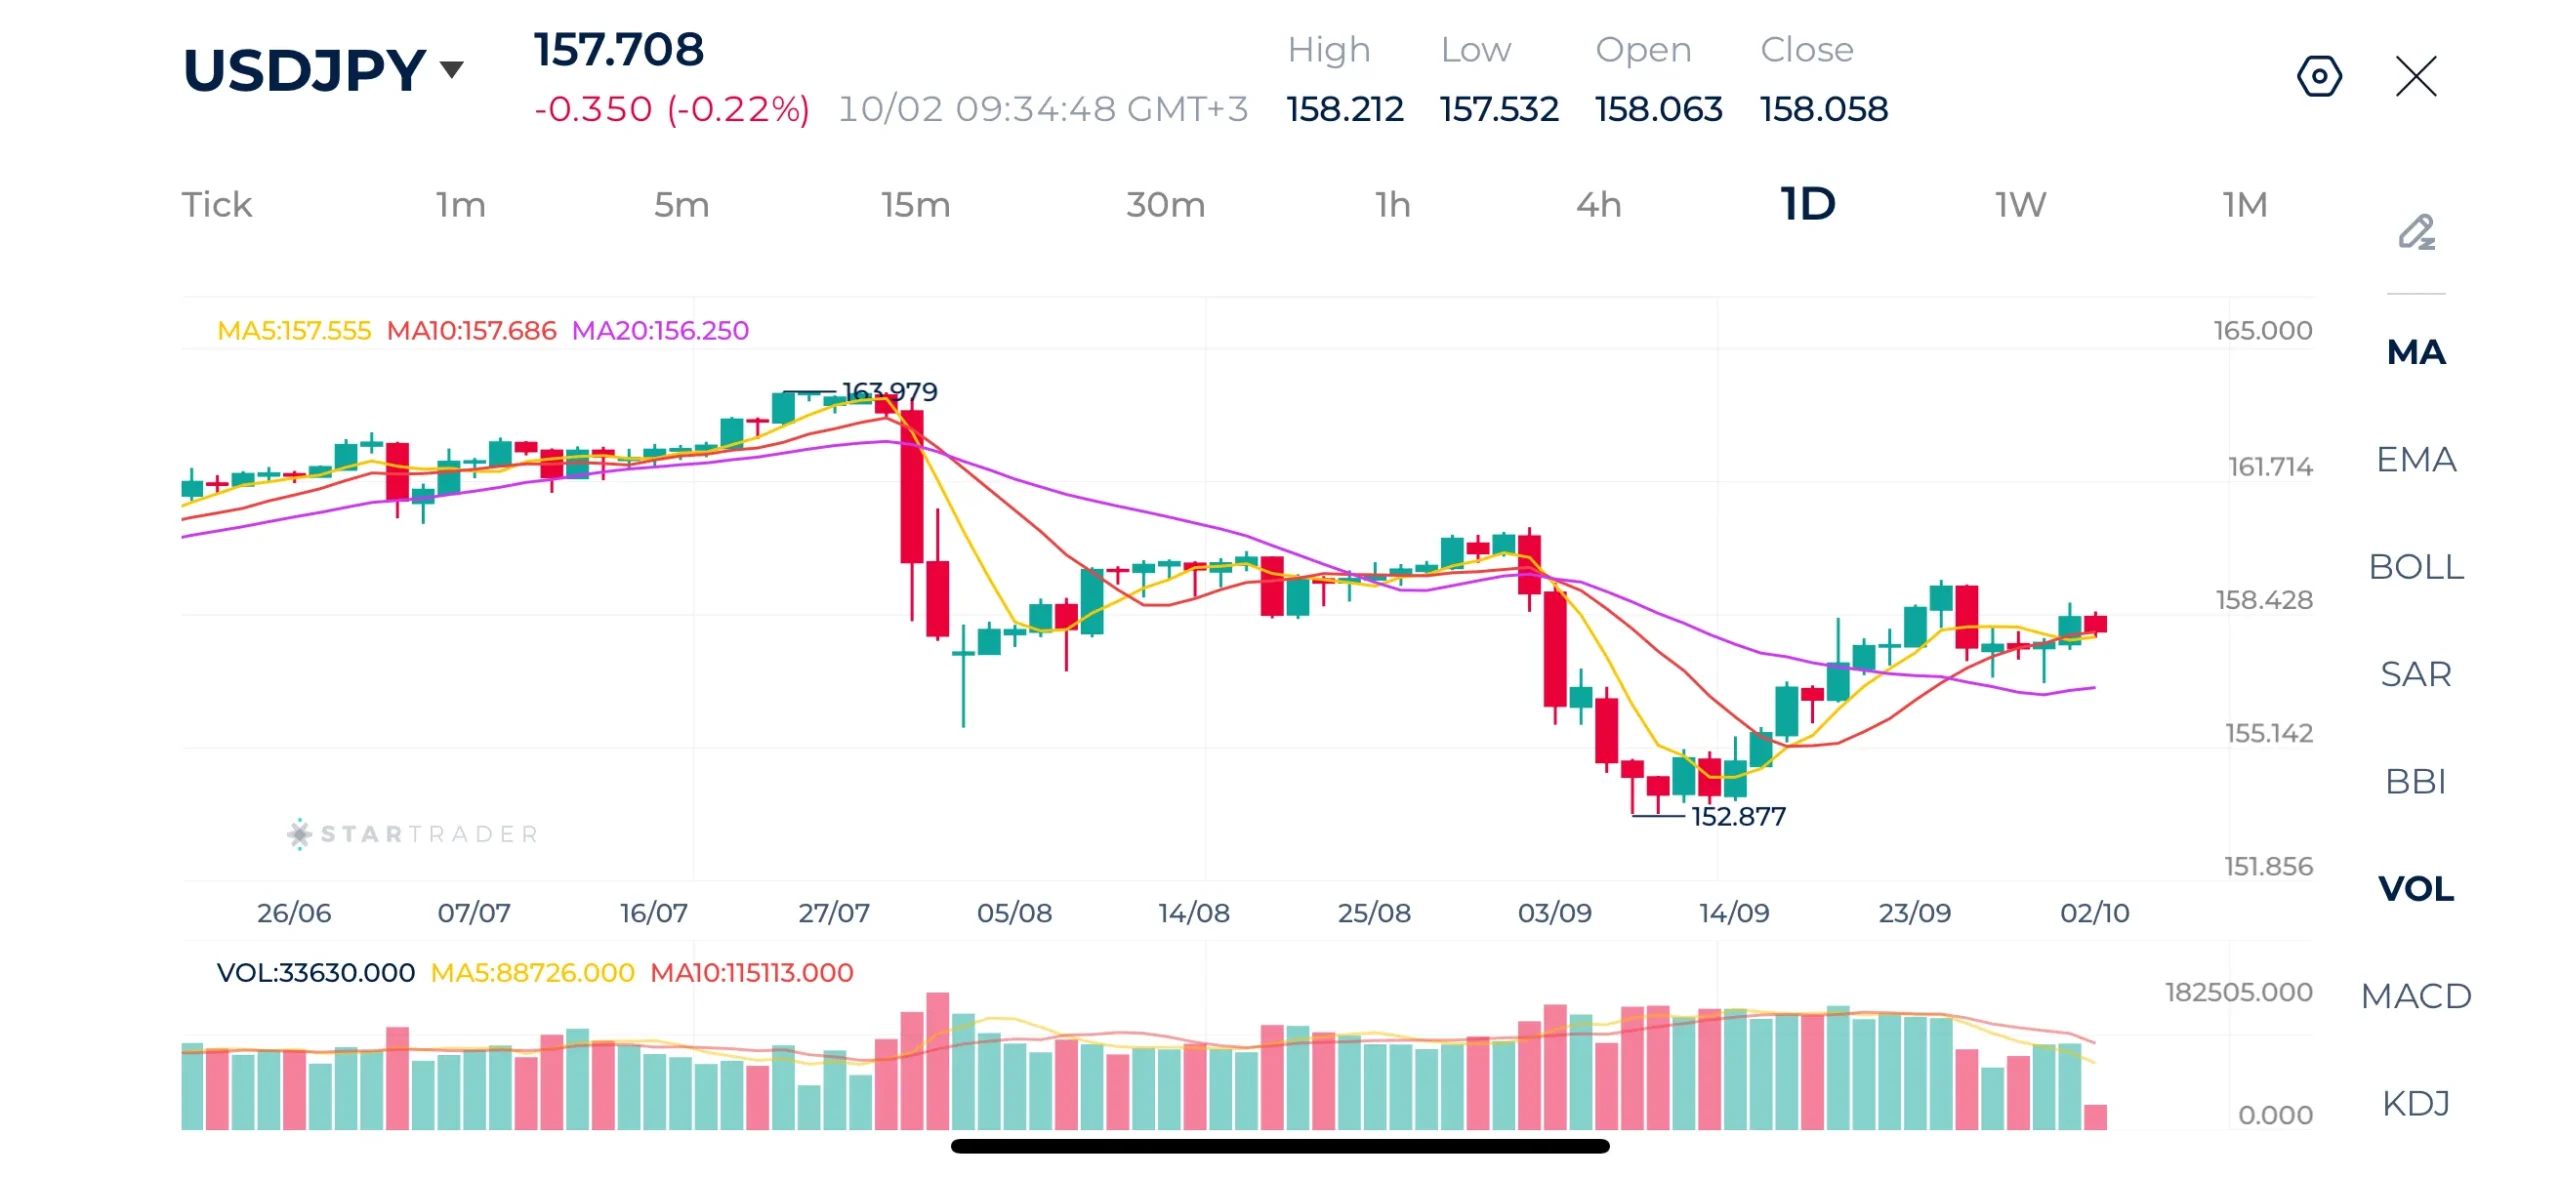
Source: STARTRADER app | USDJPY faces strong resistance while advancing higher to 159.00 levels
| Resistance | 158.50 – 158.55 | 159.21 – 159.30 | 160.00 – 160.13 |
|---|---|---|---|
| Support | 157.50 – 157.56 | 156.85 – 156.90 | 156.25 – 156.31 |
Risk Disclaimer: This material is provided for informational purposes only and does not constitute a recommendation or investment advice. Trading financial instruments on margin involves substantial risk and may not be appropriate for all investors.
Tags


Open Live Account
 Email Address
 Phone Number
Important Notice
STARTRADER does not accept any applications from Australian residents.
To comply with regulatory requirements, clicking the button will redirect you to the STARTRADER website operated by STARTRADER PRIME GLOBAL PTY LTD (ABN 65 156 005 668), an authorized Australian Financial Services Licence holder (AFSL no. 421210) regulated by the Australian Securities and Investments Commission.
Important Notice for Residents of the United Arab Emirates
In alignment with local regulatory requirements, individuals residing in the United Arab Emirates are requested to proceed via our dedicated regional platform at startrader.ae, which is operated by STARTRADER Global Financial Consultation & Financial Analysis L.L.C.. This entity is licensed by the UAE Capital Market Authority (CMA) under License No. 20200000241, and is authorised to introduce financial services and promote financial products in the UAE.
Please click the "Continue" button below to be redirected.


