








 Web Trader MT5









USDJPY Technical Analysis
USDJPY has broken down decisively, falling from a 163.90 high last week to 155.21, now and trading below all three moving averages, a clean bearish alignment. The yen rallied sharply after Japan and the US intervened in the market again, reversing more than two months of yen losses. With official intervention risk now explicitly on the table, rallies back toward 157–158 are likely to face resistance, and 155.21 becomes near-term support, a break there could accelerate the move given the asymmetric risk of further verbal or actual FX intervention.
USDJPY 1H Chart
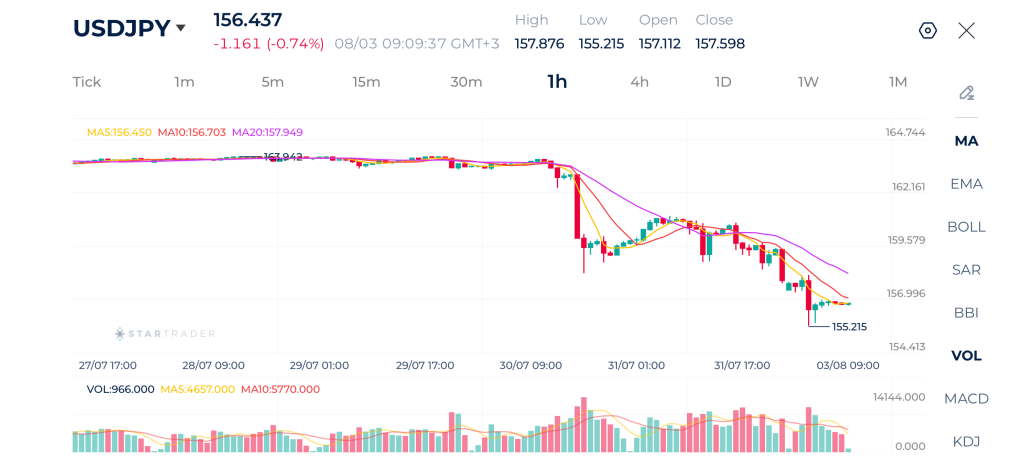
| Resistance | 157.28 | 158.41 | 159.00 |
| Support | 155.21 | 155.00 | 154.20 |
Brent Technical Analysis
Crude brent has round-tripped violently, plunging more than 7% intraday from a $92.10 close to a low of $82.79 before stabilizing near $85.00. All three moving averages have rolled over and turned lower, confirming a fresh bearish trend after weeks of war-premium-driven strength. The move lines up with the pattern that we’ve been seeing recently as brent had climbed above $88 in late July on renewed US-Iran hostilities, but this market has repeatedly given back those gains just as fast whenever de-escalation headlines hit. Structurally, the $82.79 low is now the level to watch, a break below invalidates the recent range, while the $85.30–$86.20 area is the first resistance for any relief bounce.
Brent 1H Chart
| Resistance | $85.30 | $86.20 | $88.75 |
| Support | $83.45 | $82.80 | $81.36 |
S&P 500 Technical Analysis
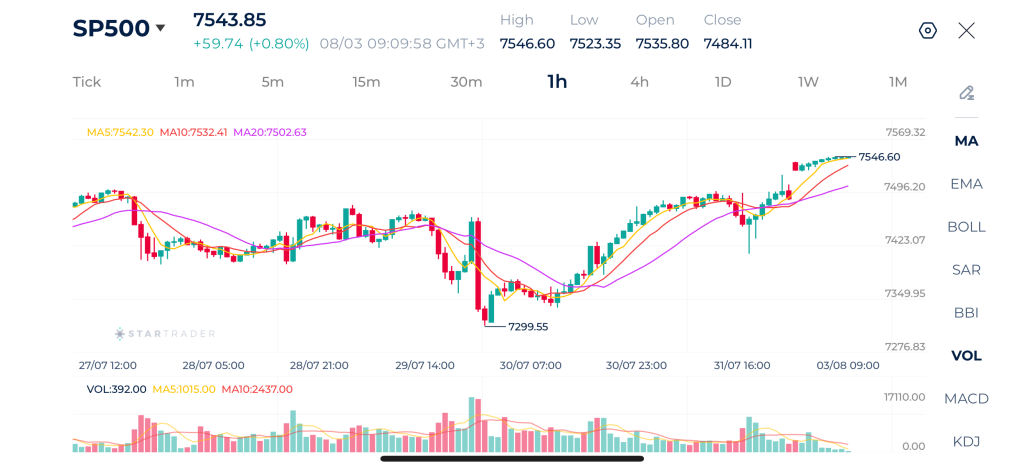
The S&P 500 is consolidating just below the 7,550 psychological level, up 0.8% on the session after a volatile week that saw a sharp dip toward 7,299 before buyers stepped back in. The 1-hour structure shows a clean V-shaped recovery. Price reclaimed the 5, 10, and 20-period MAs in sequence, with the MA5 now leading the MA10 above the MA20, a bullish price action confirming the short-term uptrend. Friday’s session was led by gains in Amazon, Alphabet and Nvidia as the AI-driven rally continues to dominate. Momentum is fading slightly into the highs, so a pause or shallow pullback toward the 7,500–7,520 zone would be healthy before another leg toward fresh records. A clean break above 7,546 opens the door to 7,569.
S&P 500 1H Chart
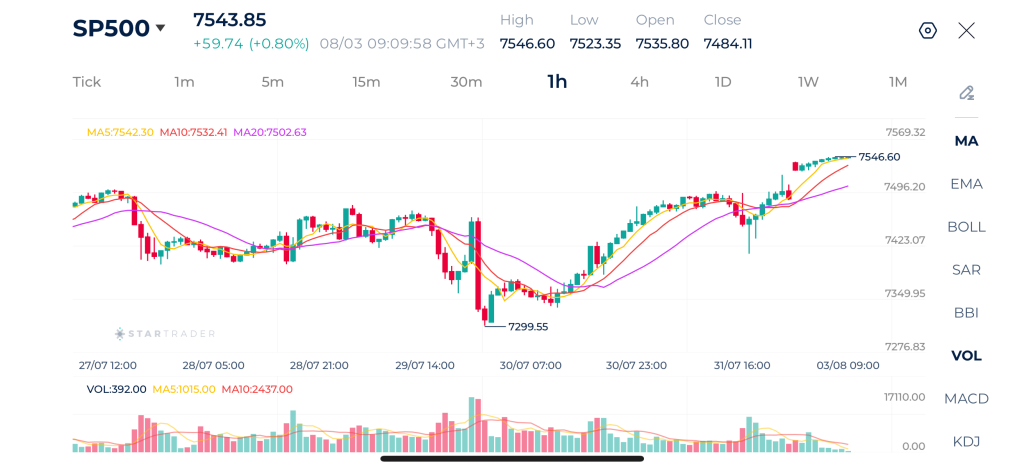
| Resistance | 7,539 | 7,580 | 7,610 |
| Support | 7,517 | 7,490 | 7,460 |
Risk Disclaimer: This material is provided for informational purposes only and does not constitute a recommendation or investment advice. Trading financial instruments on margin involves substantial risk and may not be appropriate for all investors.
Tags


Open Live Account
 Email Address
 Phone Number
Important Notice
STARTRADER does not accept any applications from Australian residents.
To comply with regulatory requirements, clicking the button will redirect you to the STARTRADER website operated by STARTRADER PRIME GLOBAL PTY LTD (ABN 65 156 005 668), an authorized Australian Financial Services Licence holder (AFSL no. 421210) regulated by the Australian Securities and Investments Commission.
Important Notice for Residents of the United Arab Emirates
In alignment with local regulatory requirements, individuals residing in the United Arab Emirates are requested to proceed via our dedicated regional platform at startrader.ae, which is operated by STARTRADER Global Financial Consultation & Financial Analysis L.L.C.. This entity is licensed by the UAE Capital Market Authority (CMA) under License No. 20200000241, and is authorised to introduce financial services and promote financial products in the UAE.
Please click the "Continue" button below to be redirected.


