


USDJPY Technical Analysis
USDJPY remains in a broader bullish trend on the 1H timeframe, but the latest price action shows signs of near term consolidation after failing to sustain a breakout above the 157.80–158.00 region. Price continues to trade above the 30-period moving average, indicating that the primary trend is still intact.
MACD is still slightly negative, while the MACD line is attempting to curl higher, signaling that downside momentum is weakening. As long as USDJPY holds above the 156.80–157.00 support zone, the bullish structure remains valid, with another attempt toward 158.00 likely. A sustained break below 156.50 would weaken the bullish bias and open the door for a deeper corrective move.
USDJPY 1H Chart
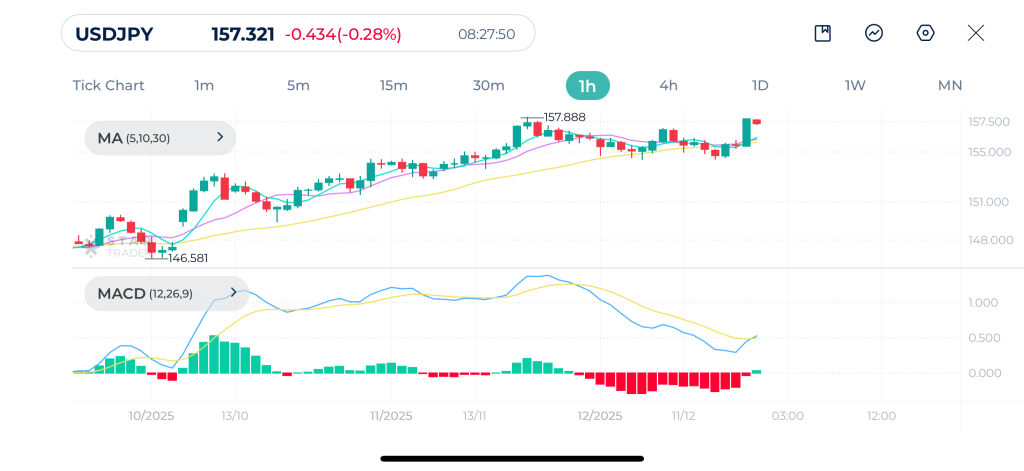
| Resistance | 157.78 | 158.00 | 158.31 |
| Support | 156.94 | 156.43 | 156.06 |
Gold Technical Analysis
Gold is displaying strong bullish momentum on the 1H timeframe after breaking decisively above the previous consolidation range and recording a new record high $4,409 level. Price action is firmly trading above all key moving averages, with the 5 and 10 MAs sharply angled upward, confirming strong trend acceleration.
The market has transitioned from consolidation into trend continuation, with former resistance around $4,350–$4,370 now acting as a key support zone.
MACD has crossed into positive territory, with the MACD line pulling away from the signal line, indicating strengthening upside momentum.
As long as gold holds above the $4,350 area, the bullish bias remains dominant, with scope for further extension toward $4,450 and beyond.
Gold 1H Chart
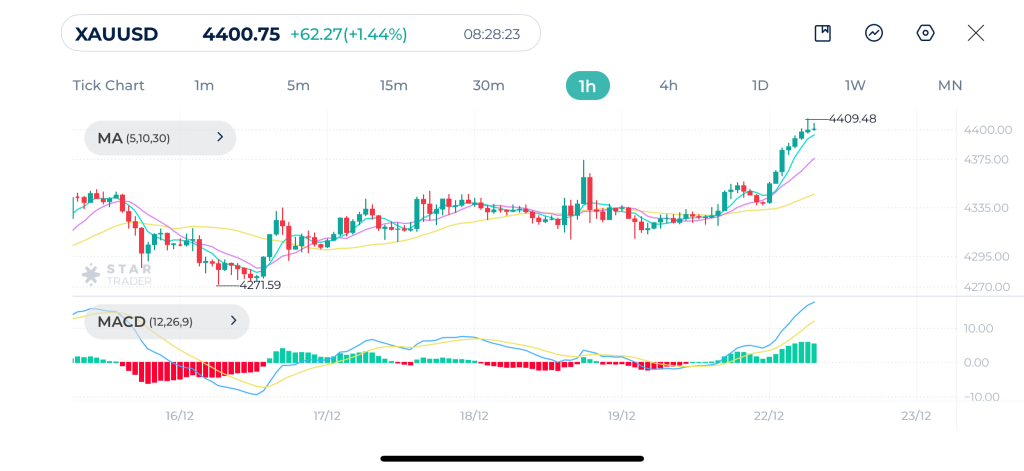
| Resistance | $4,409 | $4,425 | $4,450 |
| Support | $4,389 | $4,366 | $4,356 |
S&P500 Technical Analysis
The S&P 500 is recovering steadily from last week’s low, forming a constructive higher-low structure on the 1H chart. Price has reclaimed the short-term moving averages and is now trading above the 30-period moving average, which has begun to flatten and turn slightly higher.
MACD confirms improving momentum, with the MACD line crossing above the signal line. Immediate resistance is located around 6,880–6,920, where prior selling emerged. A clean break above this zone would confirm trend continuation, while a failure below 6,780 would be the first signal that upside momentum is fading.
S&P500 1H Chart
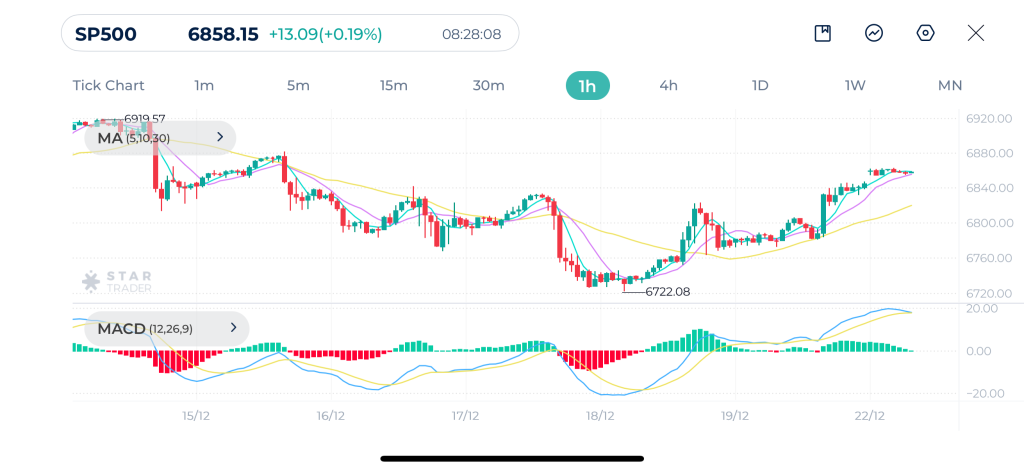
| Resistance | 6,855 | 6,871 | 6,890 |
| Support | 6,840 | 6,825 | 6,813 |
Tags
Open Live Account
Please enter a valid country
No results found
No results found
Please enter a valid email
Please enter a valid verification code
1. 8-16 characters + numbers (0-9) 2. blend of letters (A-Z, a-z) 3. special characters (e.g, !a#S%^&)
Please enter the correct format
Please tick the checkbox to proceed
Please tick the checkbox to proceed
Important Notice
STARTRADER does not accept any applications from Australian residents.
To comply with regulatory requirements, clicking the button will redirect you to the STARTRADER website operated by STARTRADER PRIME GLOBAL PTY LTD (ABN 65 156 005 668), an authorized Australian Financial Services Licence holder (AFSL no. 421210) regulated by the Australian Securities and Investments Commission.
CONTINUEImportant Notice for Residents of the United Arab Emirates
In alignment with local regulatory requirements, individuals residing in the United Arab Emirates are requested to proceed via our dedicated regional platform at startrader.ae, which is operated by STARTRADER Global Financial Consultation & Financial Analysis L.L.C.. This entity is licensed by the UAE Capital Market Authority (CMA) under License No. 20200000241, and is authorised to introduce financial services and promote financial products in the UAE.
Please click the "Continue" button below to be redirected.
CONTINUEError! Please try again.

