


Gold Technical Analysis
Gold has staged a strong rebound after finding support at $3,940, reversing much of last week’s weakness. Price has reclaimed the short-term moving averages and is now challenging the 20-period MA near $4,010, signalling improving bullish momentum.
Although the broader trend remains cautious, the recent recovery has significantly improved the technical picture.
The sharp bullish impulse from $3,942 created a strong reversal pattern, with buyers aggressively defending the previous support zone. Price has since broken above the 5 and 10-period moving averages and is attempting to establish itself above the 20-period MA.
The recent candles show consolidation just below $4,035, suggesting buyers are absorbing selling pressure before attempting another breakout.
Gold 1H Chart
| Resistance | $4,053 | $4,100 | $4,175 |
| Support | $3,959 | $3,935 | $3,900 |
Brent Technical Analysis
Brent crude has shifted from its previous bearish trend into a consolidation phase. Price is trading almost directly on top of the 5, 10 and 20-period moving averages, indicating a balanced market with limited directional conviction. The longer-term moving average has flattened, reflecting the loss of downside momentum.
After establishing support near $71.63, Brent rebounded and has since been trading sideways between approximately $72.80 and $73.80. The latest candles remain relatively small, highlighting indecision as buyers and sellers struggle for control.
The short-term outlook is neutral. A sustained break above $73.80 would strengthen the recovery toward $74.30–$75.00, while a break below $72.80 would shift momentum back in favor of the bears and expose the $71.63 support area once again.
Brent 1H Chart
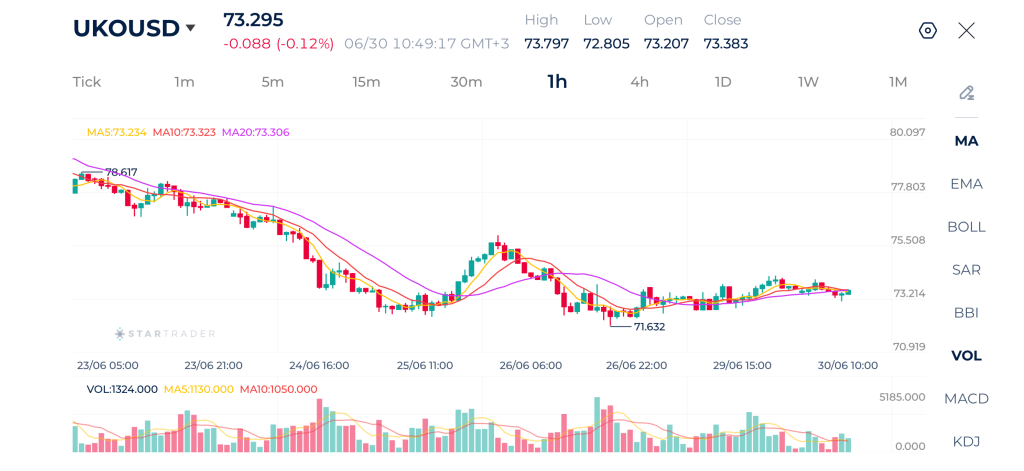
| Resistance | $74.20 | $75.50 | $77.00 |
| Support | $72.35 | $71.60 | $70.00 |
USDJPY Technical Analysis
USD/JPY remains in a short-term uptrend, with price continuing to print higher highs and higher lows. The pair is trading above all three moving averages, while the MA5 has crossed above the MA10, and both remain above the MA20, confirming strong bullish momentum.
The upward slope of the 20-period moving average suggests that buyers continue to control the broader short-term trend.
After several sessions of steady appreciation, USD/JPY accelerated higher and recently broke above the previous consolidation range around 162.00. The rally extended to a fresh swing high at 162.40, where some profit-taking has emerged.
The technical outlook remains bullish as long as USD/JPY holds above 162.00. A sustained break above 162.40 would confirm continuation of the uptrend and could pave the way for a move toward 162.70 and potentially 163.00. On the downside, a break below 162.00 would signal fading bullish momentum and increase the likelihood of a corrective pullback toward the 161.85–161.55 support area.
USDJPY 1H Chart
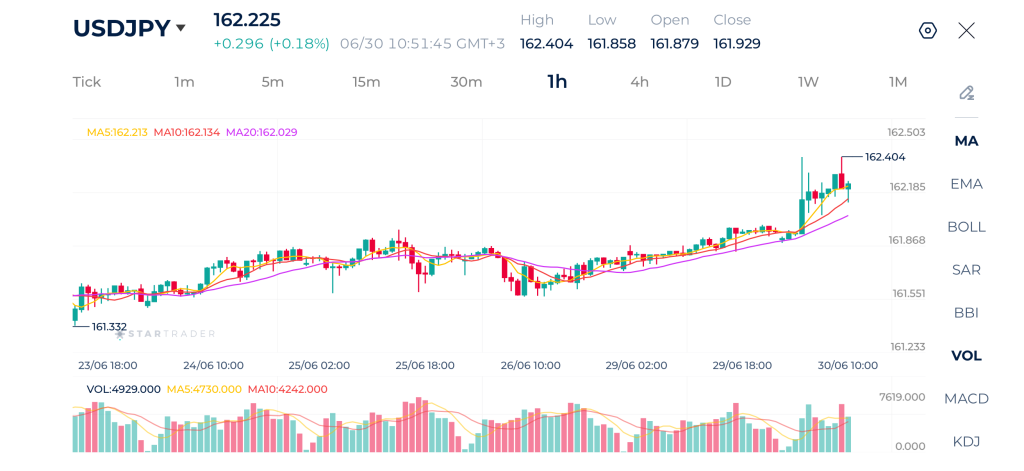
| Resistance | 162.50 | 163.00 | 163.40 |
| Support | 162.12 | 161.85 | 161.00 |
Risk Disclaimer: This material is provided for informational purposes only and does not constitute a recommendation or investment advice. Trading financial instruments on margin involves substantial risk and may not be appropriate for all investors.
Tags
Open Live Account
Please enter a valid country
No results found
No results found
Please enter a valid email
Please enter a valid verification code
1. 8-16 characters + numbers (0-9) 2. blend of letters (A-Z, a-z) 3. special characters (e.g, !a#S%^&)
Please enter the correct format
Please tick the checkbox to proceed
Please tick the checkbox to proceed
Important Notice
STARTRADER does not accept any applications from Australian residents.
To comply with regulatory requirements, clicking the button will redirect you to the STARTRADER website operated by STARTRADER PRIME GLOBAL PTY LTD (ABN 65 156 005 668), an authorized Australian Financial Services Licence holder (AFSL no. 421210) regulated by the Australian Securities and Investments Commission.
CONTINUEImportant Notice for Residents of the United Arab Emirates
In alignment with local regulatory requirements, individuals residing in the United Arab Emirates are requested to proceed via our dedicated regional platform at startrader.ae, which is operated by STARTRADER Global Financial Consultation & Financial Analysis L.L.C.. This entity is licensed by the UAE Capital Market Authority (CMA) under License No. 20200000241, and is authorised to introduce financial services and promote financial products in the UAE.
Please click the "Continue" button below to be redirected.
CONTINUEError! Please try again.

