








 Web Trader MT5











Brent Technical Analysis
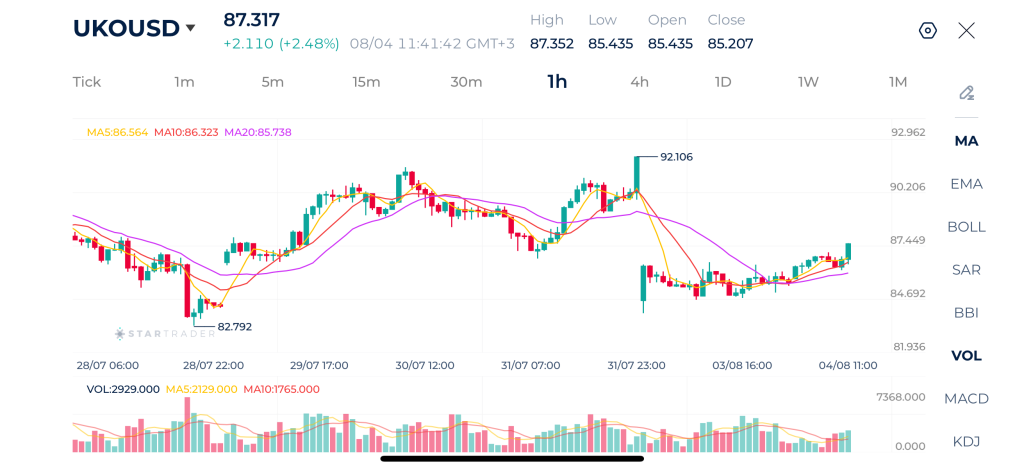
The dramatic spike in crude brent to $92.10 marks the peak of renewed geopolitical hostilities, after which price gapped down hard and has spent the last few sessions grinding out a base in the 84.70–87.45 zone, now testing back up toward the 90-level resistance where MA5 and MA10 are starting to turn higher.
The move lines up precisely with headline flow. Brent dropped about 5% to below $84 a barrel on Monday after surging over 20% in July, as Trump announced peace talks with Iran would resume. Brent ultimately settled around $83.77. Underlying supply dynamics remain bearish for the medium term , OPEC+ has approved another modest production increase, completing the planned restoration of the 2023 supply cuts which caps how far any relief rally can travel.
For now, the $87.45–$90.20 zone is the key battleground. A close back above $90 would suggest the market isn’t fully convinced the Iran de-escalation sticks, failure there and a slide back toward $84.70 would confirm the geopolitical premium is deflating in earnest, consistent with the risk-on tone in equities and the softer tone in gold.
Brent 1H Chart
| Resistance | $88.20 | $89.45 | $90.50 |
| Support | $84.70 | $82.80 | $81.20 |
Dow Jones Technical Analysis
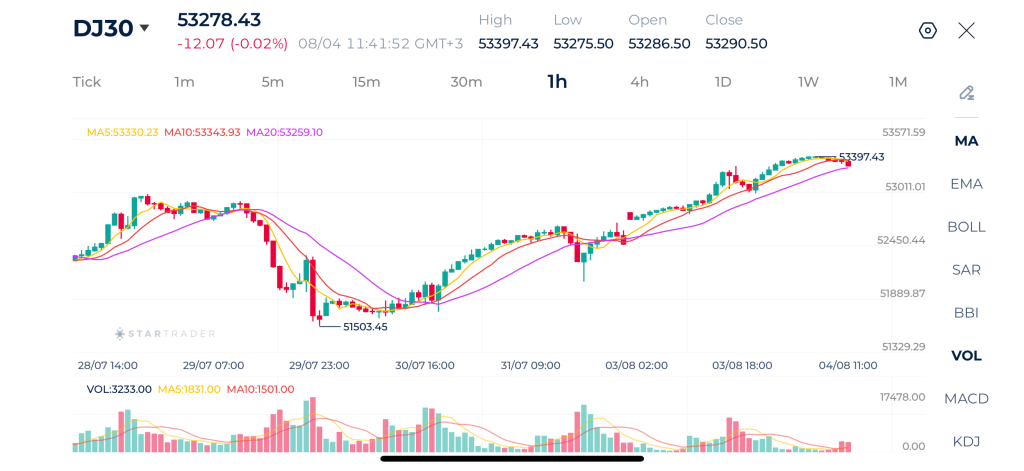
The Dow closed at a record high on Monday, jumping 693 points, or 1.32%, to settle at 53,178, and the rally was concentrated in megacap tech, with Amazon surging 4.6% to cross a $3 trillion market cap, alongside gains in Alphabet, Microsoft and Meta. The trigger was the same de-escalation story driving gold and oil in the opposite direction, investor sentiment was lifted by a roughly 5% drop in oil prices after Trump canceled planned strikes on Iran, easing inflation concerns and improving the rate outlook. Falling yields on the back of lower oil gave risk assets room to run.
Adding fuel, the ISM Manufacturing PMI printed 55.6 in July, up 2.3 points from June and the best reading since May 2022
Dow Jones 1H Chart
| Resistance | 53,400 | 53,621 | 53,700 |
| Support | 53,00 | 52,600 | 51,90 |
Gold Technical Analysis
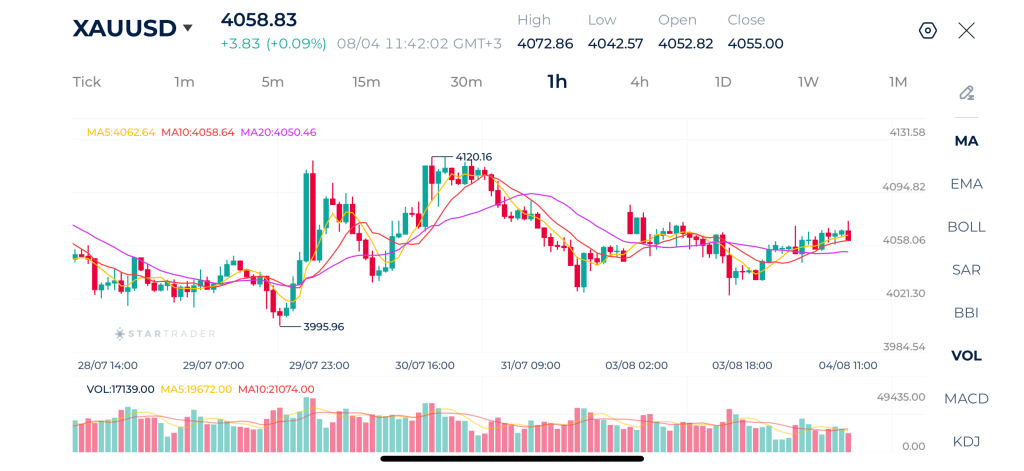
Gold is consolidating just above $4,058 after a wild week that took it from a swing low near $3,996 to a high of $4,120 before sellers stepped back in. The pattern on the hourly is a classic higher-low structure, each pullback since July 29 has found support progressively higher, even as the rally from $3,996 to $4,120 gave back a good chunk of its gains into August 3. Price is now coiling just under the $4,050–$4,062 cluster where MA5, MA10 and MA20 have converged.
Fundamentally, gold’s recent choppiness tracks almost exactly with the Iran headline risk. The spike toward $4,120 lined up with the flare-up in US-Iran tensions in late July, while the retreat since has coincided with easing safe-haven demand as investors balance a weaker dollar against reduced geopolitical risk.
The near-term catalyst is Friday’s jobs report. Traders are awaiting a series of US labor market reports culminating in Friday’s nonfarm payrolls release for clues on the Fed’s policy path. A soft print reinforces the case for cuts and should favor a break back above $4,072–4,094 a hot number likely pressures gold back toward the $4,021–3,995 levels.
Gold 1H Chart
| Resistance | $4,090 | $4,120 | $4,150 |
| Support | $4,020 | $4,000 | $3,960 |
Risk Disclaimer: This material is provided for informational purposes only and does not constitute a recommendation or investment advice. Trading financial instruments on margin involves substantial risk and may not be appropriate for all investors.
Tags


Open Live Account
 Email Address
 Phone Number
Important Notice
STARTRADER does not accept any applications from Australian residents.
To comply with regulatory requirements, clicking the button will redirect you to the STARTRADER website operated by STARTRADER PRIME GLOBAL PTY LTD (ABN 65 156 005 668), an authorized Australian Financial Services Licence holder (AFSL no. 421210) regulated by the Australian Securities and Investments Commission.
Important Notice for Residents of the United Arab Emirates
In alignment with local regulatory requirements, individuals residing in the United Arab Emirates are requested to proceed via our dedicated regional platform at startrader.ae, which is operated by STARTRADER Global Financial Consultation & Financial Analysis L.L.C.. This entity is licensed by the UAE Capital Market Authority (CMA) under License No. 20200000241, and is authorised to introduce financial services and promote financial products in the UAE.
Please click the "Continue" button below to be redirected.


