


The U.S. dollar exceeds the recent highs for a new two-decade high above 110.67 while pushing gold below $1,698 per ounce and Euro to 0.98 levels. Market experts expect the Fed and ECB to hike 75 basis points each.
U.S. Dollar Index (USDX)
The dollar will remain solid for the rest of the year as U.S. interest rates rise and the economy outperforms its peers. Backed by a strong U.S. economy, the Federal Reserve has ramped up its fight against inflation by hiking interest rates much quicker than most of its peers.
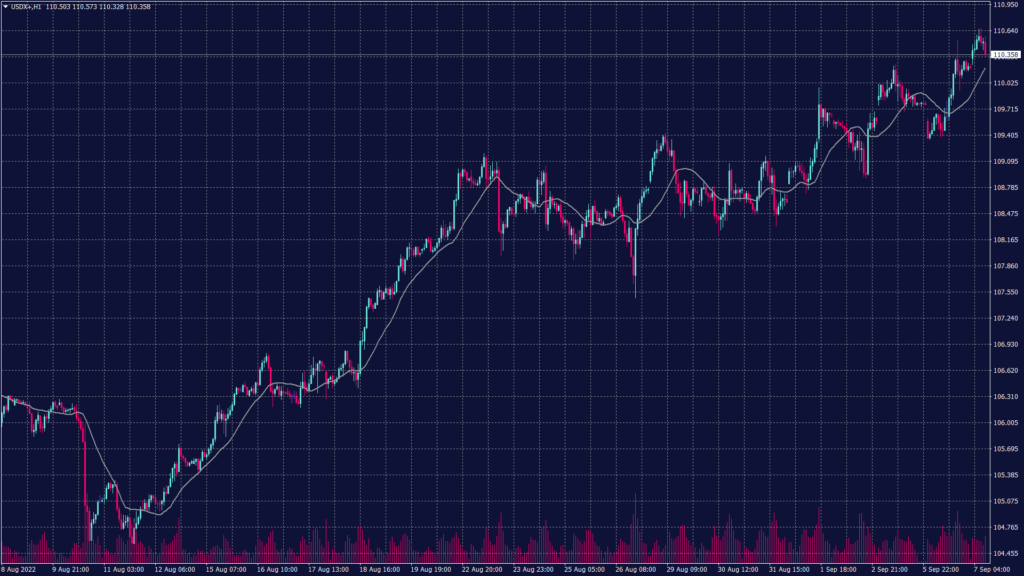
That has helped the dollar turn in one of its best performances in at least a decade. The dollar index was up around 15% for the year and touched a fresh two-decade high of 110.67 on Tuesday.
Technically, the index remains strong despite the fluctuations in the uptrend. Technical indicators show a possibility of a slowdown but also show strong support above 110.25. RSI moves flat near 70 while the MACD remains on the top.
Pivot Point: 110.40
| SUPPORT | RESISTANCE |
| 110.25 | 110.70 |
| 110.10 | 110.80 |
| 110.00 | 110.90 |
Euro (EURUSD)
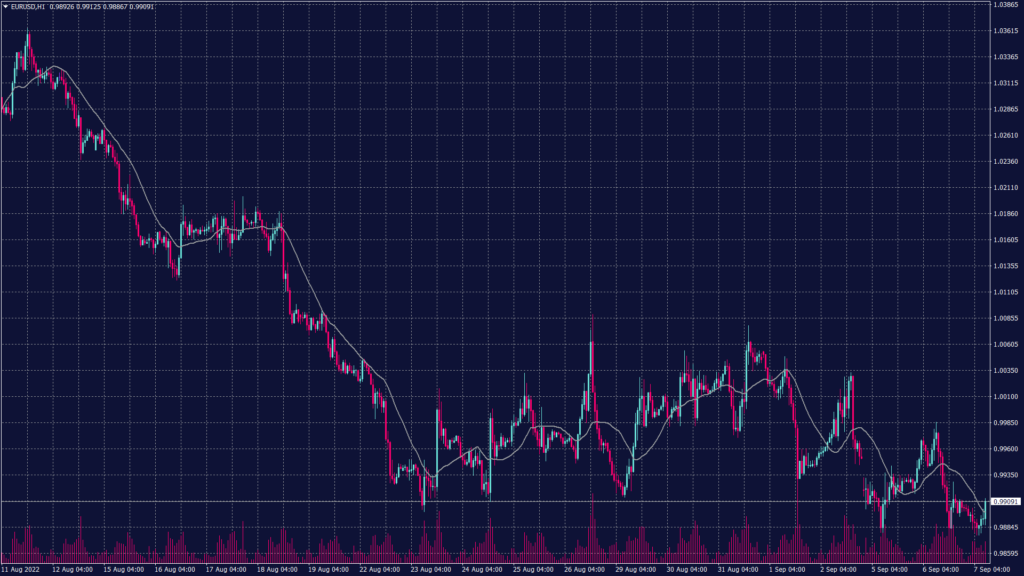
The euro hit a two-decade low of $0.9876 on Monday as the prospects for winter without Russian gas sunk in. It was expected to trade below parity over the next three months, suggesting the 75-basis point European Central Bank rate hike forecast for its Thursday meeting would do little to reverse the euro’s fortunes.
The common currency remains weak and moving on the downtrend in the daily chart heading below 0.9850. Meanwhile, the hourly chart shows light support at 0.9870 which might not hold against the heavy bearish pressure.
Pivot Point: 0.9890
| SUPPORT | RESISTANCE |
| 0.9820 | 0.9910 |
| 0.9790 | 0.9950 |
| 0.9750 | 1.0050 |
Spot Gold (XAUUSD)
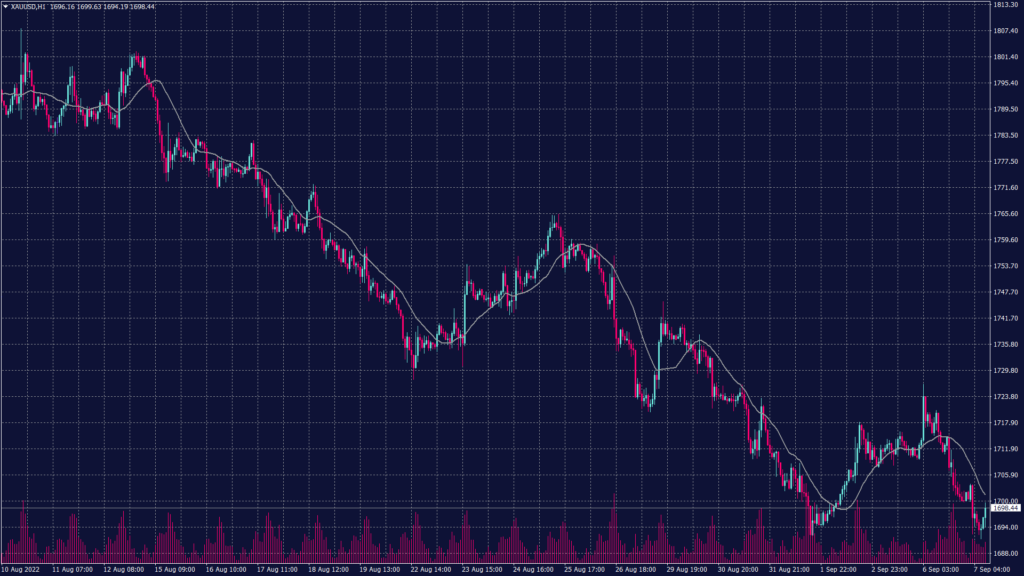
Spot gold prices briefly broke below $1,700 on Wednesday after signs of strength in the U.S. economy led to increased expectations that the Federal Reserve will keep raising interest rates at a fast pace.
Spot gold fell as much as 0.5% to $1,699.97, while gold futures fell 0.1% to $1,711.0. Both instruments had fallen 0.5% and 0.7% respectively on Tuesday and were hovering around lows last seen in late July.
Spot gold is trading under heavy bearish pressure below $1,700 per ounce while technical indicators on the daily chart show a possibility of further decline towards $1,658 per ounce. Meanwhile, the hourly chart shows support at $1,689 per ounce which is confirmed by both RSI and MACD readings.
Pivot Point: 1,700
| SUPPORT | RESISTANCE |
| 1,690 | 1,705 |
| 1,689 | 1,710 |
| 1,680 | 1,720 |
West Texas Crude (USOUSD)
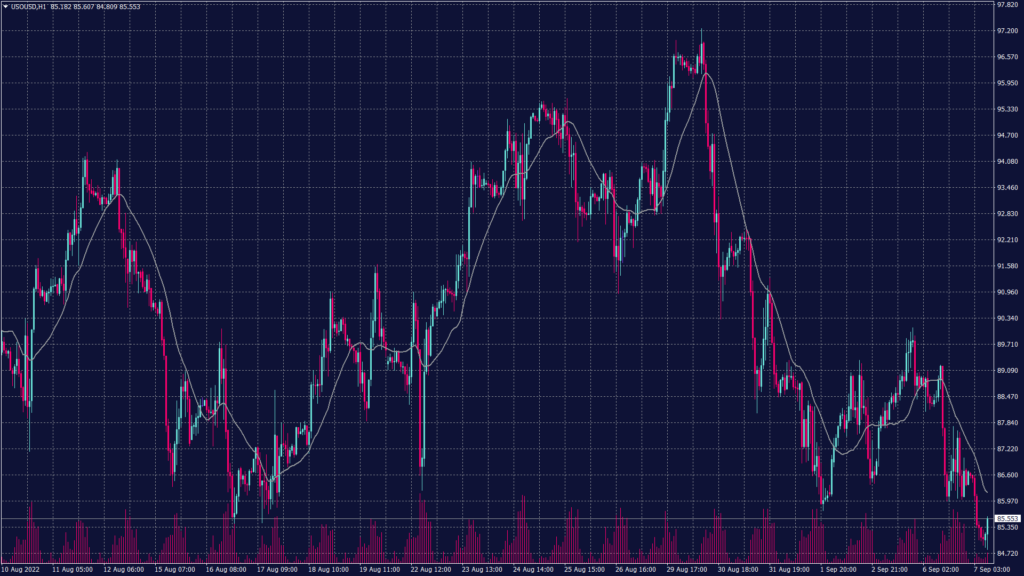
Oil prices fell to their lowest since before Russia invaded Ukraine as expectations of more interest rate hikes spurred worries of a global economic recession and lower fuel demand. Brent crude futures fell 1.5% to $91.48 a barrel while WTI futures shed 1.8% to $85.33.
Oil pared strong gains made on Monday after OPEC+ decided to cut output by 100,000 barrels per day in October. Additionally, crude inventories in the U.S. Strategic Petroleum Reserve (SPR) fell 7.5 million barrels in the week to September 2 to 442.5 million barrels, their lowest since November 1984.
Spot WTI traded lower breaking below the support at $86.70 per barrel and hitting the next support at $84.85 per ounce. The overall trend remains negative on the daily chart and signalling to break the support levels between $85.40 and $84.85 per barrel.
Pivot Point: 85.40
| SUPPORT | RESISTANCE |
| 84.85 | 85.80 |
| 81.50 | 86.70 |
| 79.70 | 87.70 |
Tags
Open Live Account
Please enter a valid country
No results found
No results found
Please enter a valid email
Please enter a valid verification code
1. 8-16 characters + numbers (0-9) 2. blend of letters (A-Z, a-z) 3. special characters (e.g, !a#S%^&)
Please enter the correct format
Please tick the checkbox to proceed
Please tick the checkbox to proceed
Important Notice
STARTRADER does not accept any applications from Australian residents.
To comply with regulatory requirements, clicking the button will redirect you to the STARTRADER website operated by STARTRADER PRIME GLOBAL PTY LTD (ABN 65 156 005 668), an authorized Australian Financial Services Licence holder (AFSL no. 421210) regulated by the Australian Securities and Investments Commission.
CONTINUEImportant Notice for Residents of the United Arab Emirates
In alignment with local regulatory requirements, individuals residing in the United Arab Emirates are requested to proceed via our dedicated regional platform at startrader.ae, which is operated by STARTRADER Global Financial Consultation & Financial Analysis L.L.C.. This entity is licensed by the UAE Capital Market Authority (CMA) under License No. 20200000241, and is authorised to introduce financial services and promote financial products in the UAE.
Please click the "Continue" button below to be redirected.
CONTINUEError! Please try again.

