


Silver Technical Analysis
Silver is maintaining a strong bullish structure, trading well above its rising 30-period moving average, which continues to act as a solid dynamic support. The sharp impulsive move higher earlier created a strong bullish leg, followed by a healthy consolidation phase above $66.00.
Short-term moving averages remain bullish, showing that buyers still control the trend despite the recent slowdown.
MACD suggests short-term momentum is cooling. As long as price holds above $65.80–$66.00, the broader bullish bias remains intact, with potential for another push toward $66.80–$67.00 if momentum picks up again.
Silver 1H Chart
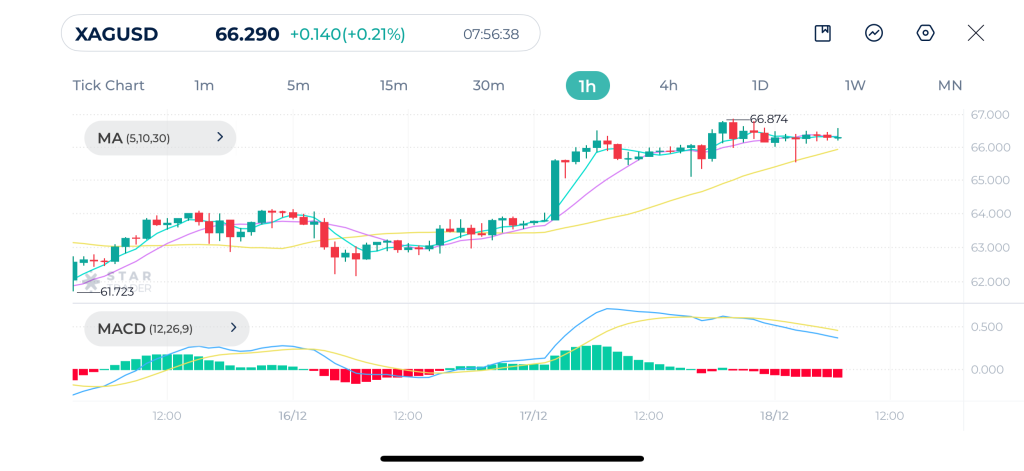
| Resistance | $66.90 | $67.20 | $67.50 |
| Support | $65.97 | $65.51 | $65.07 |
GBPUSD Technical Analysis
GBPUSD is currently in a corrective phase within a broader range, after failing to sustain gains above the 1.3450 resistance area. Price has moved back below the short-term moving averages, while the 30-period moving average is flattening, indicating a loss of directional strength.
The pair is forming lower highs on the intraday timeframe, suggesting sellers are gradually gaining control, although downside momentum remains limited for now.
MACD is signaling that bearish momentum is weakening. A sustained move below 1.3340 could open the door for deeper corrective moves, while a recovery above 1.3400–1.3420 would be needed to restore bullish momentum and challenge recent highs again.
GBPUSD 1H Chart
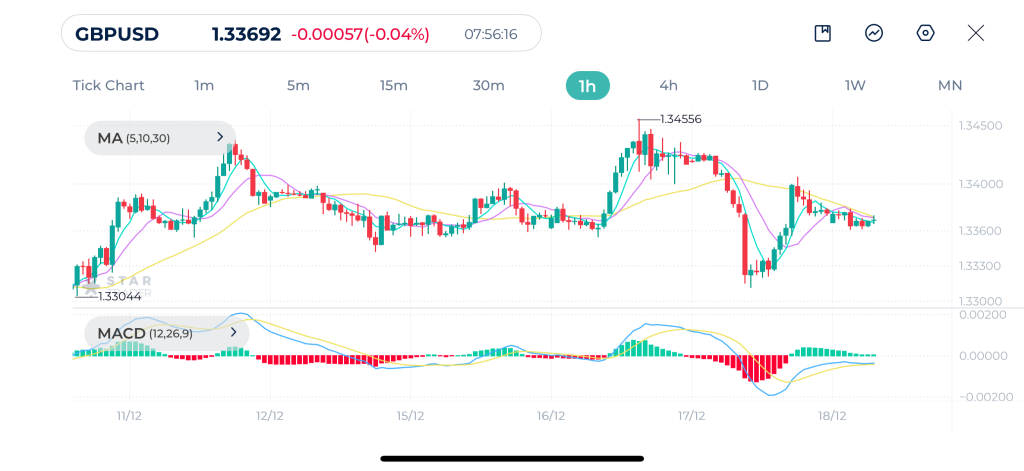
| Resistance | 1.3384 | 1.3406 | 1.3436 |
| Support | 1.3362 | 1.3345 | 1.3311 |
S&P500 Technical Analysis
The S&P 500 remains under short-term bearish pressure as seen on the hourly chart. Price has broken below the short-term moving averages MA(5) and MA(10) with the MA(30) acting as dynamic resistance, confirming a loss of bullish momentum.
The structure shows lower highs and lower lows on the intraday timeframe, suggesting sellers are still in control unless price can reclaim the 6,800–6,850 area.
MACD remains below the zero line, indicating that bearish momentum is still present despite the recent slowdown in selling. As long as price stays below the declining moving averages, downside risks remain toward the 6,700–6,720 support zone, while a recovery would require a clear break and hold above 6850.
S&P500 1H Chart
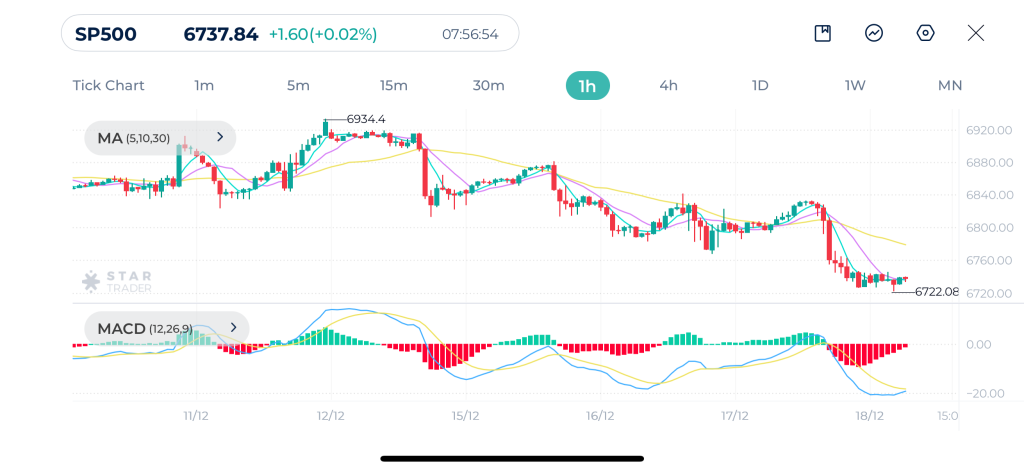
| Resistance | 6,740 | 6,758 | 6,776 |
| Support | 6,716 | 6,698 | 6,673 |
Tags
Open Live Account
Please enter a valid country
No results found
No results found
Please enter a valid email
Please enter a valid verification code
1. 8-16 characters + numbers (0-9) 2. blend of letters (A-Z, a-z) 3. special characters (e.g, !a#S%^&)
Please enter the correct format
Please tick the checkbox to proceed
Please tick the checkbox to proceed
Important Notice
STARTRADER does not accept any applications from Australian residents.
To comply with regulatory requirements, clicking the button will redirect you to the STARTRADER website operated by STARTRADER PRIME GLOBAL PTY LTD (ABN 65 156 005 668), an authorized Australian Financial Services Licence holder (AFSL no. 421210) regulated by the Australian Securities and Investments Commission.
CONTINUEImportant Notice for Residents of the United Arab Emirates
In alignment with local regulatory requirements, individuals residing in the United Arab Emirates are requested to proceed via our dedicated regional platform at startrader.ae, which is operated by STARTRADER Global Financial Consultation & Financial Analysis L.L.C.. This entity is licensed by the UAE Capital Market Authority (CMA) under License No. 20200000241, and is authorised to introduce financial services and promote financial products in the UAE.
Please click the "Continue" button below to be redirected.
CONTINUEError! Please try again.

