


Bitcoin Technical Analysis
Bitcoin continues to stabilize above the $91,000 support zone after recovering from the sharp drop earlier in November.
Recent price action shows higher lows, indicating that buyers are gradually stepping back into control. The 5-period and 10-period moving averages have crossed above the 30-period MA, a sign of short-term bullish momentum.
MACD line remains above the signal line, confirming that bullish momentum is gaining traction. However, price now faces a major resistance at $96,600, which previously acted as a pivot for the larger downtrend.
If Bitcoin manages to hold above the $90,000–$91,000 structure area, it may attempt another run toward $94,500 and $96,600. But a break below $90,000 would weaken the recovery structure and expose $87,500 as the next downside target.
Bitcoin 4H Chart
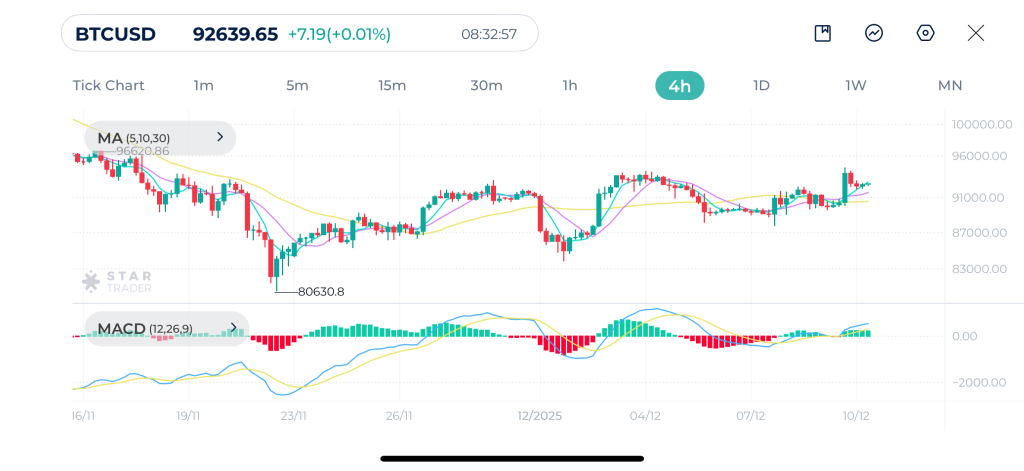
| Resistance | $94,200 | $94,608 | $95,000 |
| Support | $92,000 | $90,865 | $89,995 |
Dow Jones Technical Analysis
Dow Jones has recently entered a corrective phase after failing to extend its advance above the 48,400 zone. Price has slipped below the 5-period and 10-period moving averages on the 4H chart, indicating weakening short-term bullish momentum.
MACD confirms this slowdown, and the MACD line continues to drop below the signal line. This downward momentum suggests that sellers remain in control in the short term. Key support lies near 47,200, and a break below this level may trigger further downside toward 46,700.
However, a strong close above 47,900–48,100 would be needed to revive bullish momentum and retest the 48,400 highs.
Dow Jones 4H Chart
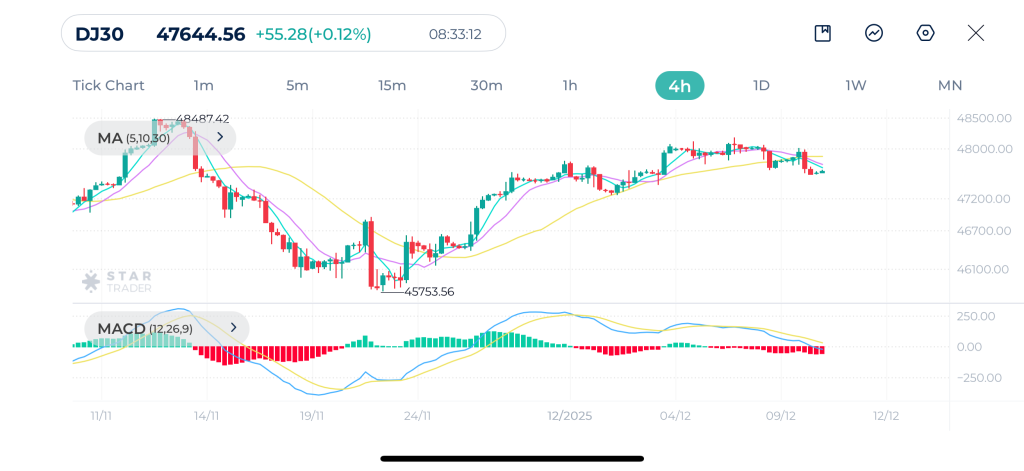
| Resistance | 47,641 | 47,697 | 47,811 |
| Support | 47,520 | 47,355 | 47,205 |
Silver Technical Analysis
Silver broke a new record high above $61 as it reached $61.47 in yesterday’s session. Today, the precious metal continued its push and it”s currently trading near the record high.
MACD line remains well above the signal line, indicating that momentum is still firmly in bullish territory. As long as silver remains above the $60.20–$60.50 zone, the upside bias remains intact. A breakout above $61.45 would likely extend the rally toward $62.20 and potentially the $63.00 psychological resistance.
Silver 1H Chart
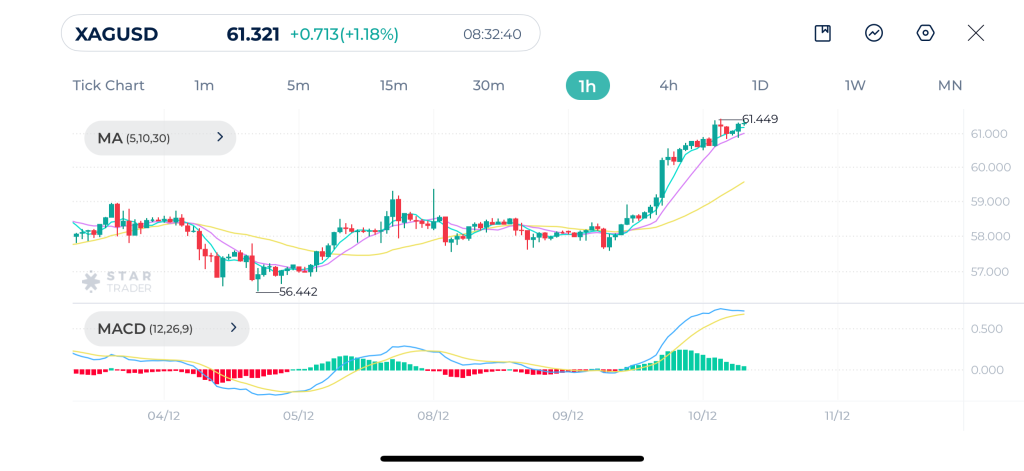
| Resistance | $61.60 | $62.00 | $62.25 |
| Support | $60.83 | $60.49 | $60.03 |
Tags
Open Live Account
Please enter a valid country
No results found
No results found
Please enter a valid email
Please enter a valid verification code
1. 8-16 characters + numbers (0-9) 2. blend of letters (A-Z, a-z) 3. special characters (e.g, !a#S%^&)
Please enter the correct format
Please tick the checkbox to proceed
Please tick the checkbox to proceed
Important Notice
STARTRADER does not accept any applications from Australian residents.
To comply with regulatory requirements, clicking the button will redirect you to the STARTRADER website operated by STARTRADER PRIME GLOBAL PTY LTD (ABN 65 156 005 668), an authorized Australian Financial Services Licence holder (AFSL no. 421210) regulated by the Australian Securities and Investments Commission.
CONTINUEImportant Notice for Residents of the United Arab Emirates
In alignment with local regulatory requirements, individuals residing in the United Arab Emirates are requested to proceed via our dedicated regional platform at startrader.ae, which is operated by STARTRADER Global Financial Consultation & Financial Analysis L.L.C.. This entity is licensed by the UAE Capital Market Authority (CMA) under License No. 20200000241, and is authorised to introduce financial services and promote financial products in the UAE.
Please click the "Continue" button below to be redirected.
CONTINUEError! Please try again.

