


Gold Technical Analysis
Gold continues to trend upward as it reached a new record high in early trading this morning.
Currently, price is pulling back slightly to test the 10-period moving average. As long as it stays above the 30-period moving average, the positive structure remains intact.
On MACD, there is a clear bearish divergence forming. This suggests the buying momentum might be exhausting, but only in the short term.
The outlook for gold remains bullish. Support is seen at $4,460–$4,480 for the precious metal.
Gold 1H Chart
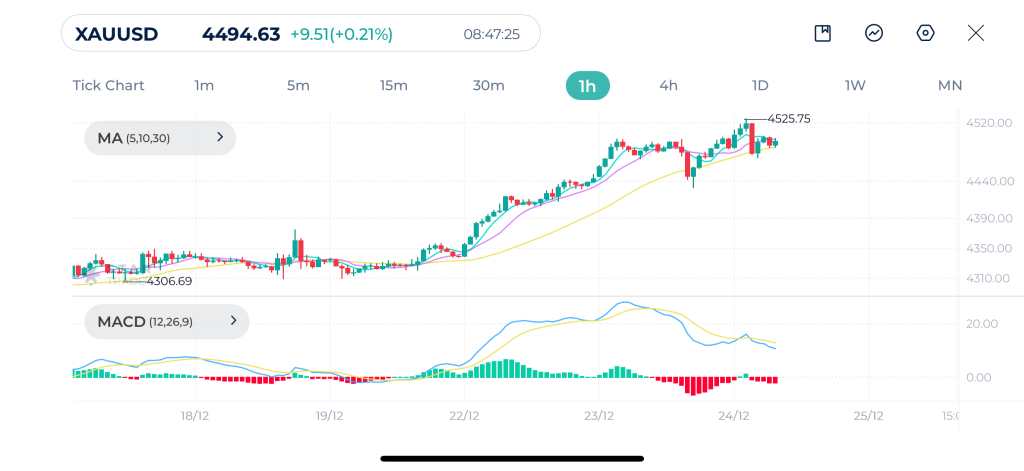
| Resistance | $4,511 | $4,528 | $4,570 |
| Support | $4,468 | $4,442 | $4,404 |
USDJPY Technical Analysis
USD/JPY is currently in a bearish phase within a larger volatile range.
Price is now hovering around the 30-period moving average. If it settles below it, a further downside toward 154 levels is likely.
On MACD, a bearish crossover has occurred, indicating that selling pressure might be increasing.
The outlook for USD/JPY is bearish to neutral. The immediate focus is on whether the 30-period moving average holds as support. A failure there suggests a trend reversal to the downside.
USDJPY 4H Chart
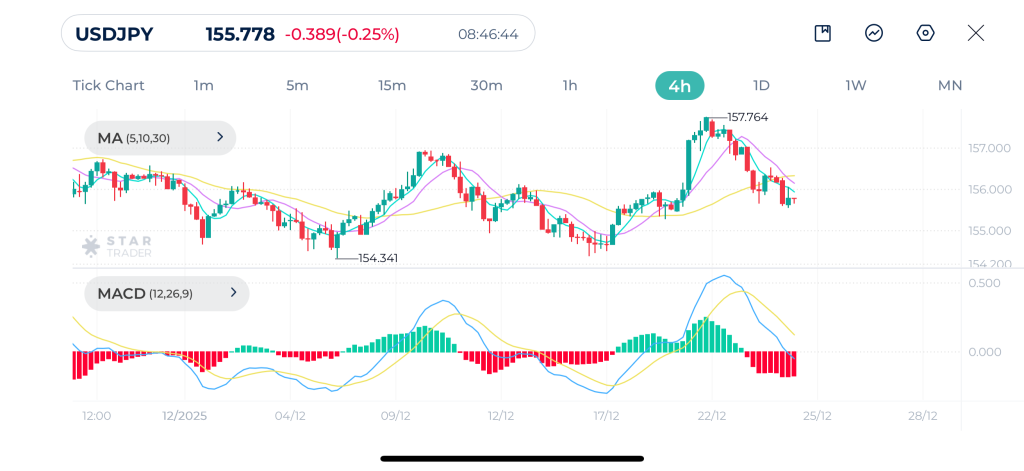
| Resistance | 156.08 | 156.54 | 157.08 |
| Support | 155.56 | 155.27 | 154.51 |
S&P500 Technical Analysis
The S&P 500 is currently nearing its record highs following a significant dip in mid-December. After forming a low on the hourly chart last week, the price has reclaimed the 5, 10, and 30-period Moving Averages, which is a bullish sign.
MACD line is above the signal line and the zero line, confirming bullish momentum. This suggests that the trend has strength, though it is approaching overbought territory.
The outlook remains bullish, but watch for a double to or rejection at 6,934. If it breaks above that level, the upward trend is likely to continue.
S&P500 1H Chart
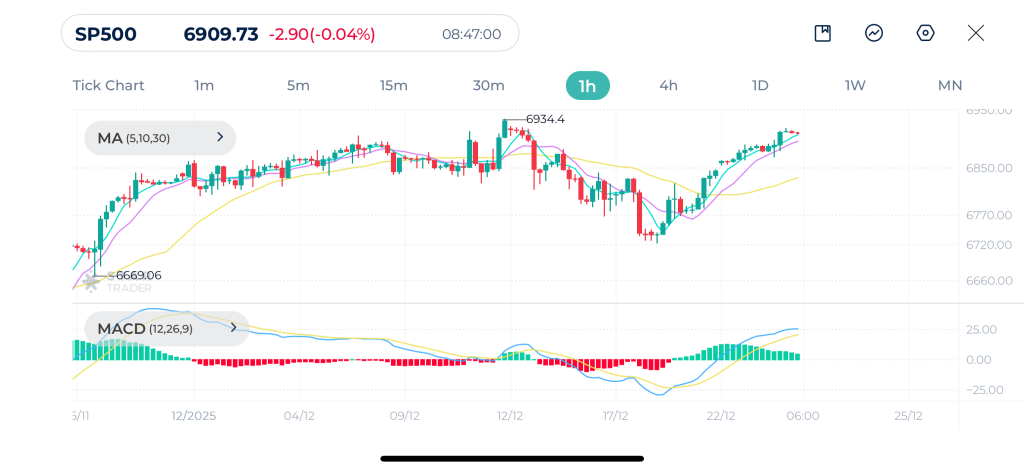
| Resistance | 6,910 | 6,925 | 6,950 |
| Support | 6,884 | 6,870 | 6,846 |
Tags
Open Live Account
Please enter a valid country
No results found
No results found
Please enter a valid email
Please enter a valid verification code
1. 8-16 characters + numbers (0-9) 2. blend of letters (A-Z, a-z) 3. special characters (e.g, !a#S%^&)
Please enter the correct format
Please tick the checkbox to proceed
Please tick the checkbox to proceed
Important Notice
STARTRADER does not accept any applications from Australian residents.
To comply with regulatory requirements, clicking the button will redirect you to the STARTRADER website operated by STARTRADER PRIME GLOBAL PTY LTD (ABN 65 156 005 668), an authorized Australian Financial Services Licence holder (AFSL no. 421210) regulated by the Australian Securities and Investments Commission.
CONTINUEImportant Notice for Residents of the United Arab Emirates
In alignment with local regulatory requirements, individuals residing in the United Arab Emirates are requested to proceed via our dedicated regional platform at startrader.ae, which is operated by STARTRADER Global Financial Consultation & Financial Analysis L.L.C.. This entity is licensed by the UAE Capital Market Authority (CMA) under License No. 20200000241, and is authorised to introduce financial services and promote financial products in the UAE.
Please click the "Continue" button below to be redirected.
CONTINUEError! Please try again.

