


EURUSD Technical Analysis
As the USD weakens, EURUSD continues the uptrend, reaching a high of 1.1706 in yesterday’s session. Following the high, the price has started to retreat slightly, hovering around 1.1680. The rapid rise led to a sharp bullish crossover, with moving averages MA 5, 10, and 30 quickly aligning in bullish order.
MACD line and Signal line are above the 0.00 line, reflecting the recent strong buying pressure.
The recent strong bullish impulse is being corrected, and the MACD suggests a further pullback or consolidation is likely before the next major move.
EURUSD 1H Chart
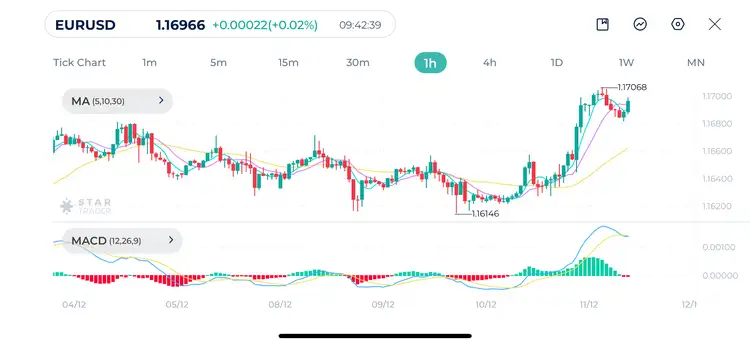
| Resistance | 1.1707 | 1.1750 | 1.1775 |
| Support | 1.1682 | 1.1661 | 1.1612 |
Nasdaq 100 Technical Analysis
Nasdaq experienced volatile trading in the last several hours. After reaching a high of 25,879, the index rose to 25,400. A break below this level would confirm further bearish continuation. Moving Averages (MA 5, 10, 30)
The faster Moving Averages (MA 5 and MA 10) have clearly crossed below the slower MA (MA 30), whish indicates bearish momentum.
The three moving averages are now sloping downwards, and the price is trading well below them, suggesting they will act as dynamic resistance if the price attempts to retrace upwards.
Nasdaq is currently still bullish in the long term. The market has just undergone a sharp, momentum-driven drop, but the uptrend is expected to resume if price remains above 25,400 levels.
Nasdaq 1H Chart
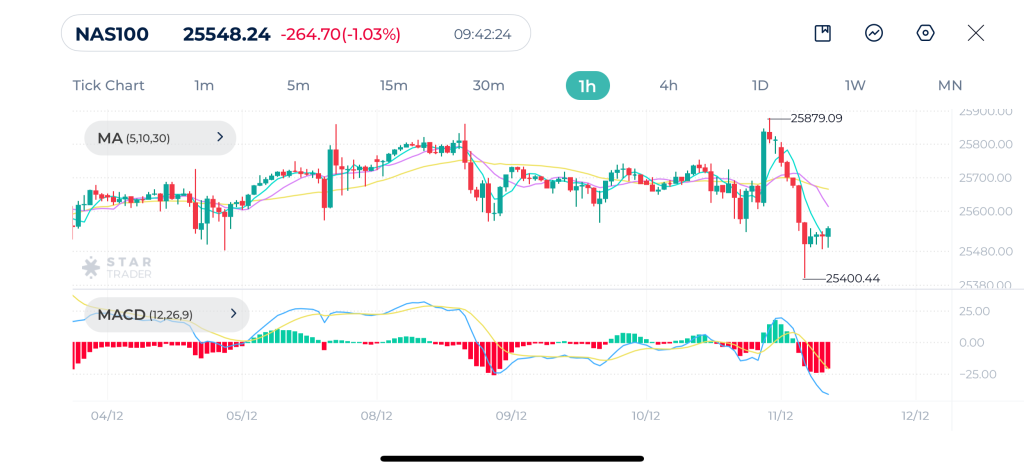
| Resistance | 25,536 | 25,586 | 25,651 |
| Support | 25,357 | 25,295 | 25,261 |
Silver Technical Analysis
Silver surged to a new record high yesterday at $62.88. The most recent candles show minor retracement or consolidation just below the high, but the overall structure remains bullish. Moving averages are well-separated and ordered with the fastest MA (5) on top, followed by the MA 10 and MA 30, a clear strong bullish signal.
MACD line and Signal line are both well above the 0.00 line, indicating strong momentum.
The strong uptrend, and positive MACD momentum suggest the rally is likely to continue after a possible minor consolidation.
Silver 1H Chart
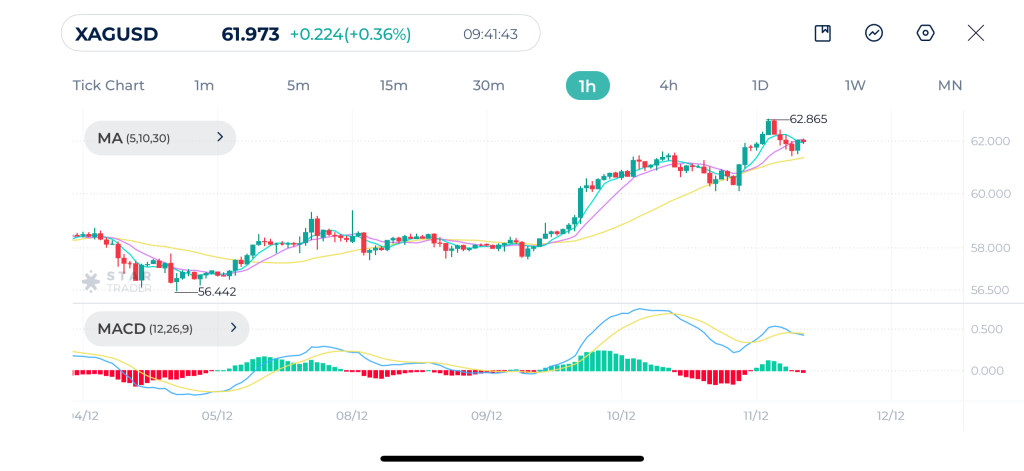
| Resistance | $62.88 | $63.00 | $63.25 |
| Support | $61.40 | $60.89 | $60.00 |
Tags
Open Live Account
Please enter a valid country
No results found
No results found
Please enter a valid email
Please enter a valid verification code
1. 8-16 characters + numbers (0-9) 2. blend of letters (A-Z, a-z) 3. special characters (e.g, !a#S%^&)
Please enter the correct format
Please tick the checkbox to proceed
Please tick the checkbox to proceed
Important Notice
STARTRADER does not accept any applications from Australian residents.
To comply with regulatory requirements, clicking the button will redirect you to the STARTRADER website operated by STARTRADER PRIME GLOBAL PTY LTD (ABN 65 156 005 668), an authorized Australian Financial Services Licence holder (AFSL no. 421210) regulated by the Australian Securities and Investments Commission.
CONTINUEImportant Notice for Residents of the United Arab Emirates
In alignment with local regulatory requirements, individuals residing in the United Arab Emirates are requested to proceed via our dedicated regional platform at startrader.ae, which is operated by STARTRADER Global Financial Consultation & Financial Analysis L.L.C.. This entity is licensed by the UAE Capital Market Authority (CMA) under License No. 20200000241, and is authorised to introduce financial services and promote financial products in the UAE.
Please click the "Continue" button below to be redirected.
CONTINUEError! Please try again.

