








 Web Trader MT5













Gold Technical Analysis
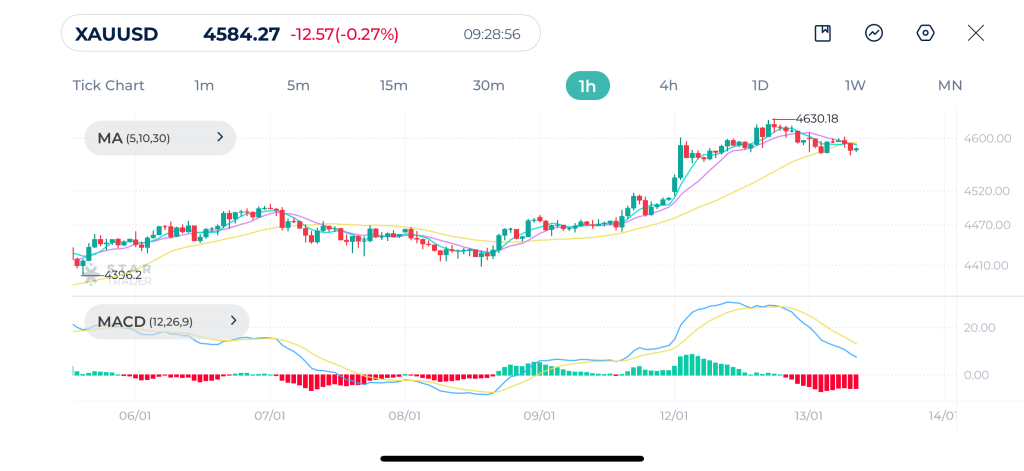
Gold remains in a broader bullish structure, but the latest price action shows short-term consolidation. After price surged aggressively toward the $4,630 area, it faced clear resistance and profit-taking, leading to a corrective move around $4,580–$4,600.
Price is still above the 30-period moving average, which confirms that the medium-term trend remains bullish. However, the faster moving averages MA(5) and MA(10) have started to flatten, suggesting loss of short-term momentum.
MACD has crossed lower, signaling bearish momentum divergence following the rally. As long as gold holds above the $4,550–$4,520 support zone, the bias remains largely bullish, with upside continuation likely if $4,630 is broken decisively.
Gold 1H Chart
| Resistance | $4,608 | $4,630 | $4,650 |
| Support | $4,561 | $4,535 | $4,520 |
S&P 500 Technical Analysis
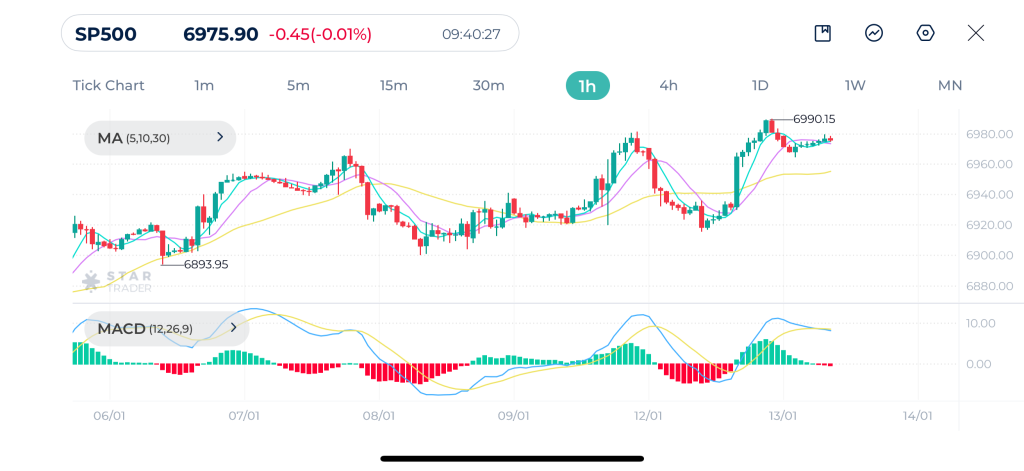
S&P 500 displays a clear bullish market structure characterized by a series of higher highs and higher lows. The index is currently pushing toward fresh record highs as it reached 6,987 yesterday, inching closer to the 7,000 psychological mark.
Price action is consistently respecting the primary moving average MA(5), MA(10) and MA(30), reinforcing a strong structural uptrend.
MACD line recently crossed above the signal line, indicating positive momentum in the short term. However, broader analysis suggests a bearish divergence while prices are hitting new highs.
A decisive hourly close above 6,990 would likely trigger a spike toward the 7,050 . Conversely, a break below 6,910 would signal a deeper retracement toward the 6,800 range.
S&P 500 1H Chart
| Resistance | 6,986 | 6,993 | 7,000 |
| Support | 6,960 | 6,946 | 6,932 |
USDJPY Technical Analysis
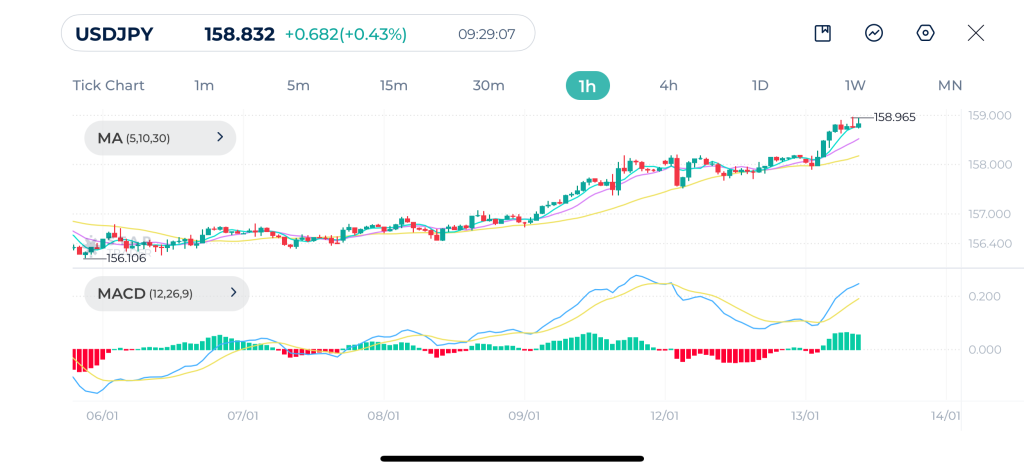
USDJPY continues to trade within a strong bullish trend on the hourly chart, registering higher highs and higher lows, supported by rising moving averages. Price is firmly above the 30-period moving average, indicating strong trend momentum.
The recent breakout above the 158.50–158.70 resistance zone confirms trend continuation, with price now consolidating just below 159.00, a psychologically important level. This behavior typically signals bullish continuation, especially without aggressive rejection candles.
MACD shows a fresh bullish expansion. This confirms that momentum is re-accelerating, aligning with the bullish price structure. As long as USDJPY holds above 158.20–158.00, the pair remains structurally bullish, with 159.30–160.00 as the next upside targets.
USDJPY 1H Chart
| Resistance | 156.00 | 156.35 | 156.70 |
| Support | 158.51 | 158.20 | 147.75 |
Tags


Open Live Account
 Email Address
 Phone Number
Important Notice
STARTRADER does not accept any applications from Australian residents.
To comply with regulatory requirements, clicking the button will redirect you to the STARTRADER website operated by STARTRADER PRIME GLOBAL PTY LTD (ABN 65 156 005 668), an authorized Australian Financial Services Licence holder (AFSL no. 421210) regulated by the Australian Securities and Investments Commission.
Important Notice for Residents of the United Arab Emirates
In alignment with local regulatory requirements, individuals residing in the United Arab Emirates are requested to proceed via our dedicated regional platform at startrader.ae, which is operated by STARTRADER Global Financial Consultation & Financial Analysis L.L.C.. This entity is licensed by the UAE Capital Market Authority (CMA) under License No. 20200000241, and is authorised to introduce financial services and promote financial products in the UAE.
Please click the "Continue" button below to be redirected.


