








 Web Trader MT5











AUDUSD Technical Analysis
AUDUSD remains structurally bullish on the 1H chart, with price holding above the key 0.6665 support and gradually pushing higher toward the 0.6727 resistance. The recent pullback was shallow and corrective, followed by a steady recovery, which suggests strong underlying demand for the pair.
Price has reclaimed all three moving averages (5, 10, and 30), and they are now aligned in bullish order. As long as price stays above 0.6690–0.6700, the overall trend remains bullish.
MACD has completed a bullish crossover below the zero line, with the histogram turning green and expanding. If momentum continues to build, AUDUSD could retest 0.6730, and a clean breakout above that level may open the door toward 0.6760–0.6780 in the short term.
AUDUSD 1H Chart
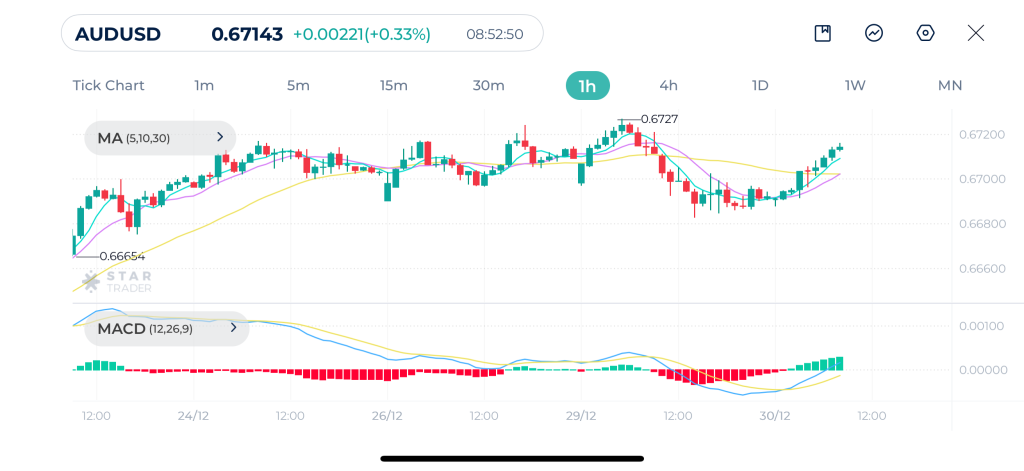
| Resistance | 0.6721 | 0.6754 | 0.6826 |
| Support | 0.6705 | 0.6697 | 0.6683 |
Dow Jones Technical Analysis
Dow Jones remains in a broader bullish structure but has entered a consolidation phase after failing to sustain gains above 48,830. Price action shows a gradual pullback due to profit-taking. The index is currently ranging just above the 48,400–48,500 support zone.
Technically, price has slipped below the fast moving averages (5 and 10) and is now hovering close to the 30-period moving average, which is acting as near-term dynamic support. As long as the index holds above this average, the broader bullish bias remains intact. A clean break below the 30-period moving average could open the door for a deeper retracement toward 48,000, while a rebound above 48,650 would signal renewed bullish momentum.
MACD line is flattening and starting to curve upward, which could precede a bullish crossover if buying interest returns. This setup favors range-bound to mildly bullish price action in the near term.
Dow Jones 1H Chart
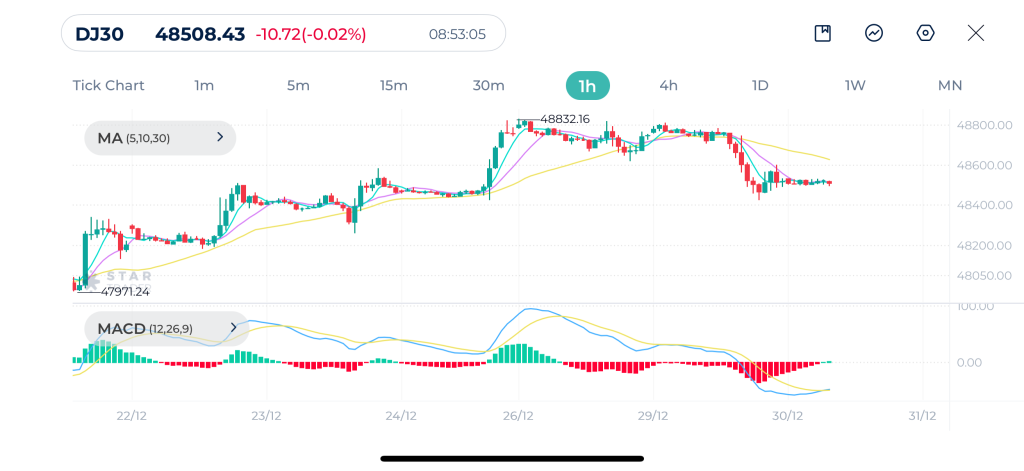
| Resistance | 48,559 | 48,572 | 48,621 |
| Support | 48,389 | 48,319 | 48,216 |
Gold Technical Analysis
Gold experienced a strong bullish move yesterday peaking at $4,550, before entering a sharp corrective phase that pushed prices down to the $4,302. This drop was aggressive and impulsive, indicating profit-taking after an extended rally. Price is currently attempting to stabilize and rebound from the recent low.
Price is still trading below the 30-period moving average on the hourly chart. However, the shorter moving averages MA(5) and MA(10) have started to turn upward and are attempting a bullish crossover, which hints at a potential short-term recovery or corrective bounce. For any sustained upside, gold needs to reclaim and hold above the MA(30), which now acts as dynamic resistance.
This momentum shift suggests that selling pressure is fading and that gold could continue to make a corrective move higher toward the $4,400–$4,450 zone, while a failure to hold above $4,300 would reopen downside risks.
Gold 1H Chart
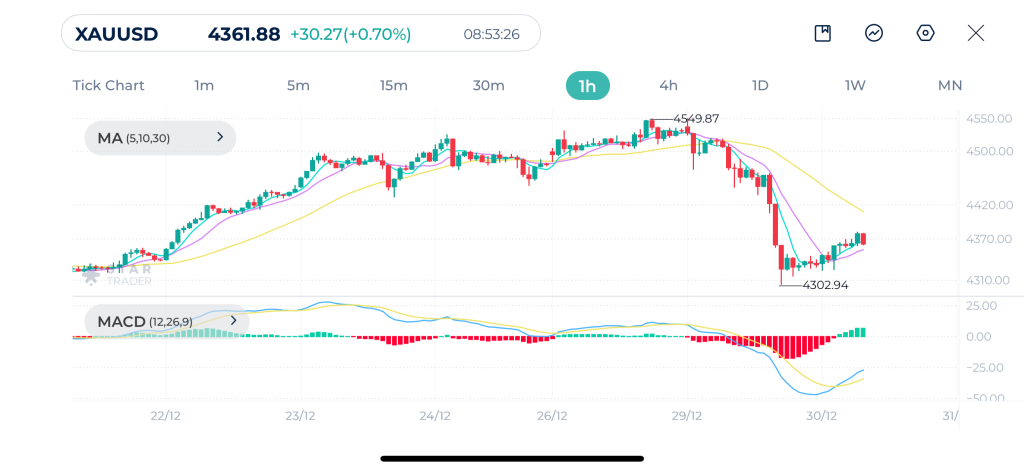
| Resistance | $4,404 | $4,430 | $4,458 |
| Support | $4,323 | $4,302 | $4,283 |
Tags


Open Live Account
 Email Address
 Phone Number
Important Notice
STARTRADER does not accept any applications from Australian residents.
To comply with regulatory requirements, clicking the button will redirect you to the STARTRADER website operated by STARTRADER PRIME GLOBAL PTY LTD (ABN 65 156 005 668), an authorized Australian Financial Services Licence holder (AFSL no. 421210) regulated by the Australian Securities and Investments Commission.
Important Notice for Residents of the United Arab Emirates
In alignment with local regulatory requirements, individuals residing in the United Arab Emirates are requested to proceed via our dedicated regional platform at startrader.ae, which is operated by STARTRADER Global Financial Consultation & Financial Analysis L.L.C.. This entity is licensed by the UAE Capital Market Authority (CMA) under License No. 20200000241, and is authorised to introduce financial services and promote financial products in the UAE.
Please click the "Continue" button below to be redirected.


