








 Web Trader MT5













Brent Technical Analysis
Brent is experiencing a sharp intraday selloff, trading at around $66.60 after breaking lower from the $70–$71 resistance zone. The short term structure has shifted bearish, as price has produced a sequence of strong bearish candles. The rejection from the $71.10 highs marks a failed continuation move.
Price has broken below the three moving averages, MA(5), MA(10), and MA(30), all of which have turned lower. This alignment suggests that rallies toward the $67.80–$68.50 area are likely to face selling pressure.
MACD is expanding negatively, and the MACD line is accelerating below the signal line and below the zero level. This indicates increasing downside momentum. The $65.80–$66.00 area is the next key support zone, and unless price quickly reclaims the $68.50 level, the intraday outlook remains bearish.
Brent 1H Chart
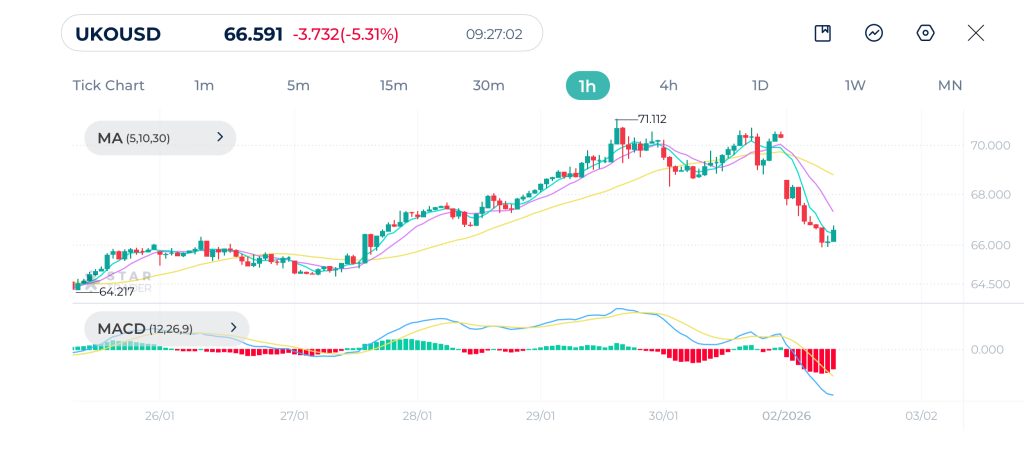
| Resistance | $66.91 | $67.38 | $68.00 |
| Support | $65.28 | $64.39 | $64.05 |
Gold Technical Analysis
Gold is undergoing a violent correction, trading near $4,400 after collapsing from the 5,600 region. The short term structure has flipped firmly bearish, with price breaking multiple support levels in quick succession.
The moving averages reflect this shift clearly. Price is now well below the moving averages MA(5), MA(10), and MA(30) with all three sloping downward.
MACD is deeply negative and still expanding, while the MACD line continues to diverge lower below the signal line. From a technical perspective, the $4,400–4,450 area is a critical support zone to monitor, but until momentum stabilizes, the bias remains bearish on the 1-hour timeframe.
Gold 1H Chart
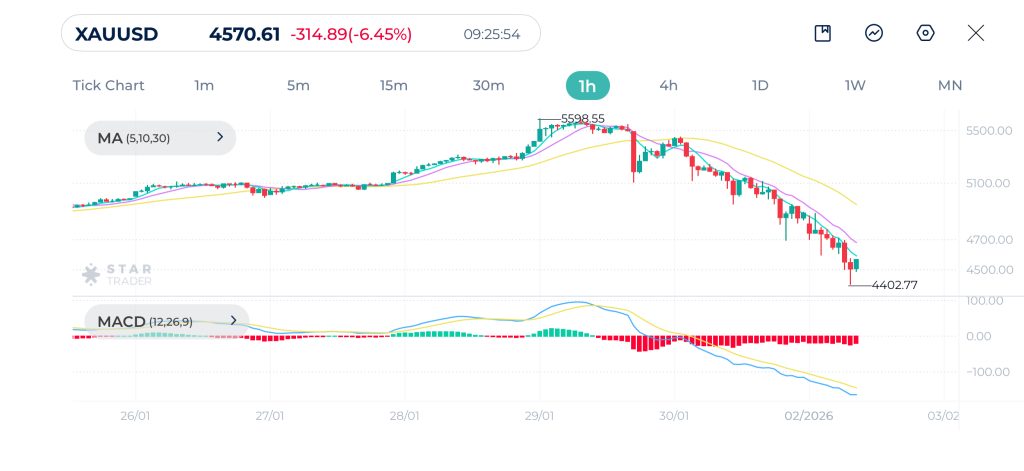
| Resistance | $4,645 | $4,715 | $4,778 |
| Support | $4,403 | $4,376 | $4,309 |
Bitcoin Technical Analysis
Bitcoin is trading near $76,400 after extending its downtrend from the $90,600 highs. The short term structure remains bearish, with price consistently printing lower highs and lower lows and failing to sustain any meaningful recovery attempts. The recent breakdown below the $78,000 level reinforces the bearish continuation scenario.
Price remains below the three moving averages MA(5), MA(10), and MA(30), all of which are aligned bearishly and sloping downward.
MACD remains below the zero line, although downside momentum is starting to moderate slightly. This hints at short term stabilization but not yet a reversal. The $74,500–$75,000 zone is the next key support area, and unless Bitcoin can reclaim and hold above $80,000, the intraday bias remains largely bearish.
Bitcoin 1H Chart
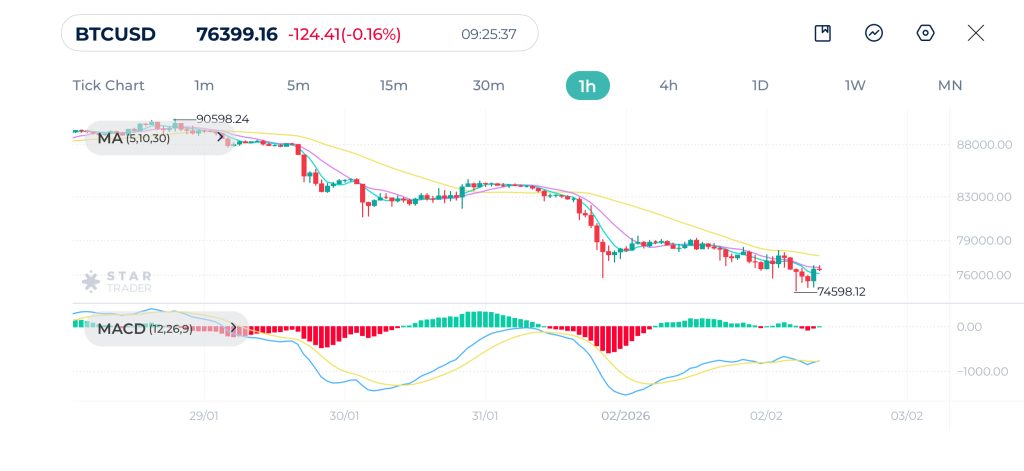
| Resistance | $78,091 | $78,368 | $79,151 |
| Support | $75,436 | $74,545 | $73,805 |
Tags


Open Live Account
 Email Address
 Phone Number
Important Notice
STARTRADER does not accept any applications from Australian residents.
To comply with regulatory requirements, clicking the button will redirect you to the STARTRADER website operated by STARTRADER PRIME GLOBAL PTY LTD (ABN 65 156 005 668), an authorized Australian Financial Services Licence holder (AFSL no. 421210) regulated by the Australian Securities and Investments Commission.
Important Notice for Residents of the United Arab Emirates
In alignment with local regulatory requirements, individuals residing in the United Arab Emirates are requested to proceed via our dedicated regional platform at startrader.ae, which is operated by STARTRADER Global Financial Consultation & Financial Analysis L.L.C.. This entity is licensed by the UAE Capital Market Authority (CMA) under License No. 20200000241, and is authorised to introduce financial services and promote financial products in the UAE.
Please click the "Continue" button below to be redirected.


