


Gold Technical Analysis
Gold remains in a steady long term uptrend with clear higher highs and higher lows also seen on the 1H timeframe. The 30-period moving average continues to slope upward, and price remains above it, indicating that the broader intraday bullish structure is intact.
The shorter moving averages (5 and 10) are relatively flat, reflecting the current consolidation. MACD momentum previously expanded strongly during the rally but has since cooled.
Immediate support sits near $5,120–$5,150, followed by stronger structural support around $5,050–$5,080. A breakout above $5,250 would signal bullish continuation, while a break below $5,050 would likely trigger a deeper retracement toward the rising 30-period moving average and prior demand zones.
Gold 1H Chart
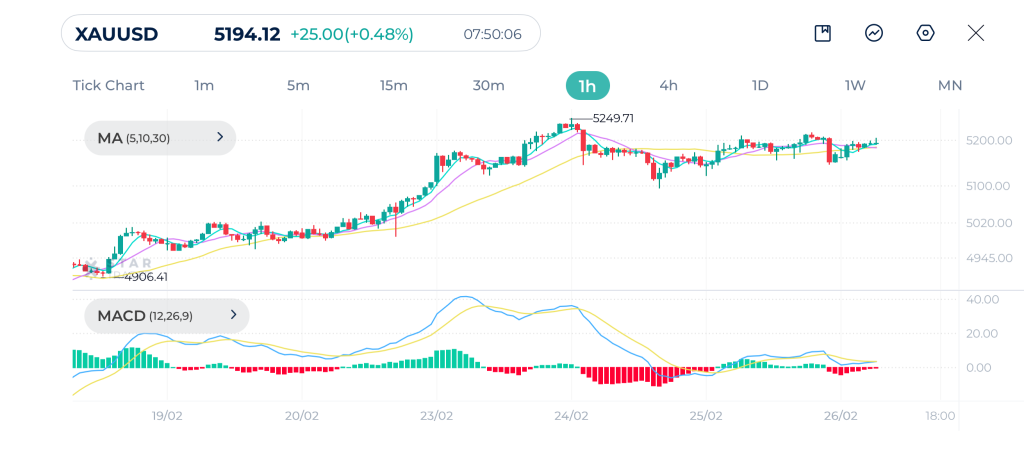
| Resistance | $5,217 | $5,250 | $5,300 |
| Support | $5,173 | $5,155 | $5,136 |
S&P500 Technical Analysis
S&P 500 has recently shifted from choppy range conditions into a bullish breakout phase. After forming a swing low near 6,820, price accelerated upward in a series of strong bullish candles, pushing to a high near 6,971. The moving averages are now aligned to the upside, with the 5 and 10 above the longer MA(30). This confirms improving short term trend conditions.
However, the latest candles show mild rejection from the 6,970 area, suggesting near term resistance. The MACD expanded positively during the rally but is now showing contraction and a potential bearish crossover development. While momentum is slowing, the indicator remains above the zero line, preserving the bullish bias unless confirmed otherwise.
Immediate support is seen at 6,900–6,910, followed by stronger support near 6,870–6,880. As long as price holds above 6,870, the structure favors continuation toward 7,000 and beyond. A clear break below 6,850 would weaken the bullish structure and signal a potential return to range conditions.
S&P500 1H Chart
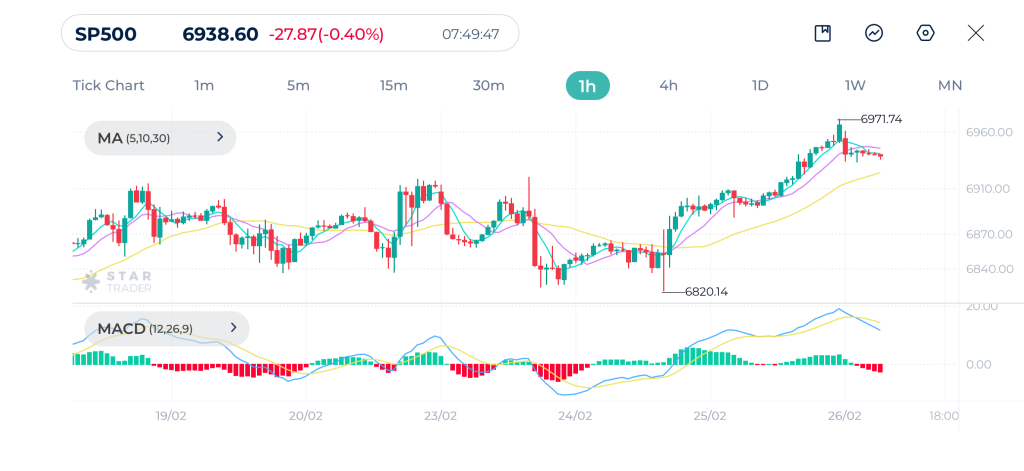
| Resistance | 6,969 | 6,990 | 7,000 |
| Support | 6,930 | 6,916 | 6,904 |
Bitcoin Technical Analysis
Bitcoin has recently transitioned from a sharp corrective decline into a strong bullish recovery. After bottoming near $62,000 earlier during the week, Bitcoin formed a clear reversal structure with higher lows and strong impulsive candles pushing price back toward the $70,000 region. The moving averages (5, 10, 30) are now bullishly aligned, with the short term averages above the 30-period moving average. This confirms short term trend strength.
MACD reflects this shift in structure. Momentum expanded strongly into positive territory during the rally. The MACD line remains above zero, which keeps the broader intraday bias bullish. Technically, $68,000–$68,500 now acts as near term support, with stronger structural support around $66,500–$67,000. A clean breakout above $70,000 would likely trigger continuation toward fresh highs, while failure to hold above $67,000 would suggest a deeper pullback toward the rising moving average MA(30).
Bitcoin 1H Chart
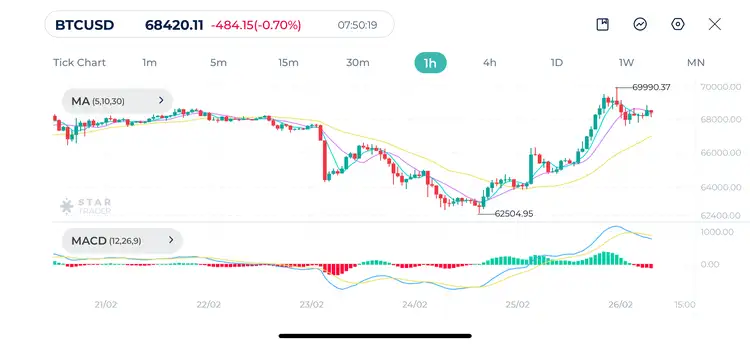
| Resistance | $69,183 | $69,950 | $70,900 |
| Support | $67,621 | $66,589 | $65,700 |
Tags
Open Live Account
Please enter a valid country
No results found
No results found
Please enter a valid email
Please enter a valid verification code
1. 8-16 characters + numbers (0-9) 2. blend of letters (A-Z, a-z) 3. special characters (e.g, !a#S%^&)
Please enter the correct format
Please tick the checkbox to proceed
Please tick the checkbox to proceed
Important Notice
STARTRADER does not accept any applications from Australian residents.
To comply with regulatory requirements, clicking the button will redirect you to the STARTRADER website operated by STARTRADER PRIME GLOBAL PTY LTD (ABN 65 156 005 668), an authorized Australian Financial Services Licence holder (AFSL no. 421210) regulated by the Australian Securities and Investments Commission.
CONTINUEImportant Notice for Residents of the United Arab Emirates
In alignment with local regulatory requirements, individuals residing in the United Arab Emirates are requested to proceed via our dedicated regional platform at startrader.ae, which is operated by STARTRADER Global Financial Consultation & Financial Analysis L.L.C.. This entity is licensed by the UAE Capital Market Authority (CMA) under License No. 20200000241, and is authorised to introduce financial services and promote financial products in the UAE.
Please click the "Continue" button below to be redirected.
CONTINUEError! Please try again.

