


Gold Technical Analysis
Gold continues to display a very strong bullish trend on the 4-hour chart, with price extending higher and printing fresh highs near the $4,880–$4,890 zone. The rally has been clean and impulsive, with minimal pullbacks, highlighting strong buyer dominance and persistent demand. Market structure remains firmly bullish.
The moving averages strongly confirm trend strength. Price is well above the moving averages MA(5), MA(10), and MA(30), all of which are positively aligned and sloping higher and are acting as dynamic support.
MACD momentum is also firmly supportive, with the indicator well above the zero line and the histogram expanding positively. As long as gold holds above the $4,750–$4,700 region, the trend remains intact, and any consolidation is more likely to resolve to the upside rather than reverse.
Gold 4H Chart
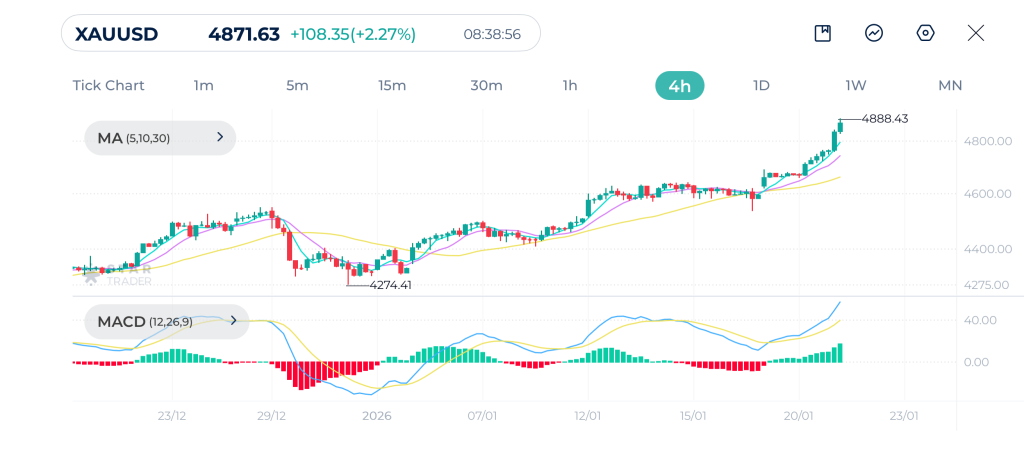
| Resistance | $4,889 | $4,920 | $4,958 |
| Support | $4,820 | $4,760 | $4,684 |
Dow Jones Technical Analysis
Dow Jones is undergoing a corrective phase on the 4-hour timeframe. After failing to sustain momentum above that high, price rolled over and began forming lower highs. The current pullback indicates profit taking within a broader bullish contex.
Price has slipped below moving averages MA(5) and MA(10) and is now hovering around the 30-period moving average. This zone is technically important, as the 30-period moving average has previously acted as dynamic support during the uptrend. A sustained hold above this level would favor a continuation of the broader bullish structure, while a clean break below it would open the door for a deeper correction toward the 48,000–47,800 region.
Momentum has weakened notably, as reflected by the MACD. The indicator has crossed into negative territory, with expanding red histogram bars, signaling growing bearish momentum on the intraday level. Overall, the index remains in a medium-term bullish structure, but the short-term bias stays cautious unless price reclaims the short-term moving averages and momentum turns back upward.
Dow Jones 4H Chart
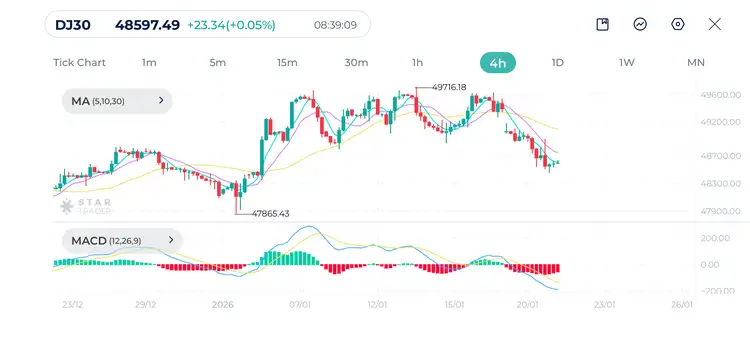
| Resistance | 48,786 | 48,916 | 49,080 |
| Support | 48,436 | 48,238 | 48,034 |
Bitcoin Technical Analysis
Bitcoin’s 4-hour chart reflects a clear deterioration in structure following the rejection near the $97,900 highs. After failing to hold above that level, price broke decisively below the key moving average cluster and accelerated lower, confirming a short-term bearish trend. The sequence of lower highs and lower lows suggests that sellers have regained control after a failed bullish continuation attempt.
Price is trading well below the moving averages, MA(5), MA(10), and MA(30), all of which have turned downward. The short-term averages are now acting as dynamic resistance, and previous support near the $92,000–$93,000 zone has flipped into resistance.
MACD confirms the bearish outlook, as the indicator is deeply below the zero line. This reflects sustained downside momentum. While short-term stabilization near the $89,000–$90,000 area is possible, there are no clear momentum signals yet to suggest a meaningful reversal. Unless Bitcoin regains the $92,000–$94,000 region, the broader 4-hour bias remains bearish.
Bitcoin 4H Chart
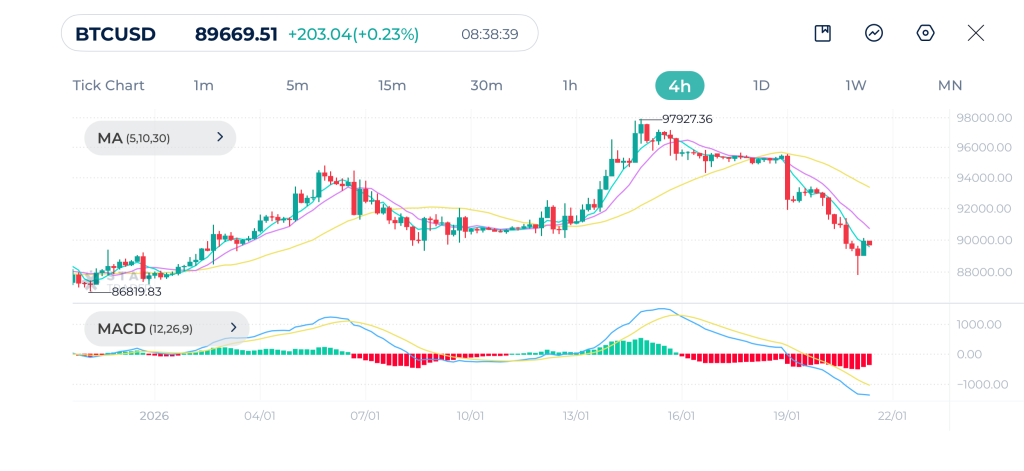
| Resistance | $90,049 | $91,390 | $92,050 |
| Support | $87,861 | $86,826 | $85,792 |
Tags
Open Live Account
Please enter a valid country
No results found
No results found
Please enter a valid email
Please enter a valid verification code
1. 8-16 characters + numbers (0-9) 2. blend of letters (A-Z, a-z) 3. special characters (e.g, !a#S%^&)
Please enter the correct format
Please tick the checkbox to proceed
Please tick the checkbox to proceed
Important Notice
STARTRADER does not accept any applications from Australian residents.
To comply with regulatory requirements, clicking the button will redirect you to the STARTRADER website operated by STARTRADER PRIME GLOBAL PTY LTD (ABN 65 156 005 668), an authorized Australian Financial Services Licence holder (AFSL no. 421210) regulated by the Australian Securities and Investments Commission.
CONTINUEImportant Notice for Residents of the United Arab Emirates
In alignment with local regulatory requirements, individuals residing in the United Arab Emirates are requested to proceed via our dedicated regional platform at startrader.ae, which is operated by STARTRADER Global Financial Consultation & Financial Analysis L.L.C.. This entity is licensed by the UAE Capital Market Authority (CMA) under License No. 20200000241, and is authorised to introduce financial services and promote financial products in the UAE.
Please click the "Continue" button below to be redirected.
CONTINUEError! Please try again.

