


Federal Reserve Chair Jerome Powell’s signal of higher-for-longer interest rates coursed through markets Monday, sinking stocks and equity futures and lifting two-year Treasury yields to levels last seen in 2007.
U.S. Dollar Index (USDX)
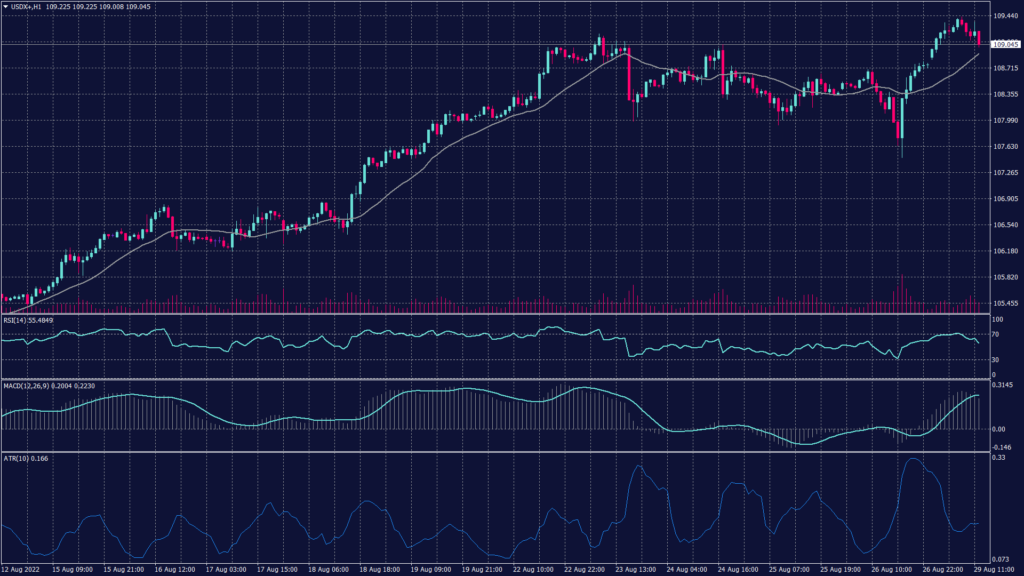
Fed’s chairman’s hawkish tone increased the demand for the dollar pushing the U.S. Dollar Index to a new two-decade high above 109.40. On Friday, Federal Reserve Chair Jerome Powell signaled interest rates would be kept higher for longer to bring down skyrocketing inflation.
Yields on U.S. Treasuries were also up on Monday on the back of Powell’s comments, with the two-year yields rising to 3.4890%, the highest since late 2007, while the 10-year yields stood at around 3.1229%.
Technically, the dollar index remains positive overall despite the slowdown after recording the two-decade high above 109.40. Furthermore, the daily chart remains positive targeting 109.80 and 110.20 if the resistance at 109.40 was penetrated. However, the hourly chart shows a slight slowdown and decline over the last few hours in the chart.
PIVOT POINT: 109.00
| SUPPORT | RESISTANCE |
| 108.75 | 109.10 |
| 108.40 | 109.40 |
| 108.10 | 109.80 |
Euro (EURUSD)
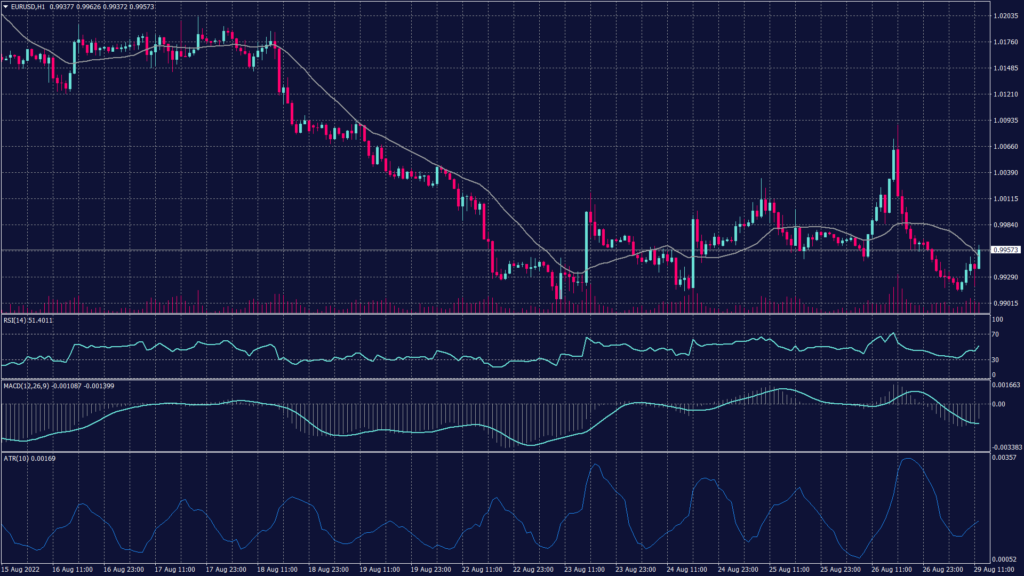
The U.S. Dollar advance left the European currency indifferent under the parity levels even as hawkish European Central Bank comments boosted expectations for a supersized September rate hike.
The euro was down a quarter of a percent in early European trade at $0.99415 within sight of recent 20-year lows.
The European currency rebounds from the support at 0.9910 to exceed the parity levels as the greenback weakens. Technical indicators show a possibility for the continuation of the downtrend regardless of the RSI neutral level at the hourly chart. Meanwhile, the daily chart confirms the decline and remains to pressure the current levels towards 0.9850.
PIVOT POINT: 0.9990
| SUPPORT | RESISTANCE |
| 0.9950 | 0.9950 |
| 0.9850 | 0.9990 |
| 0.9800 | 1.0010 |
Spot Gold (XAUUSD)
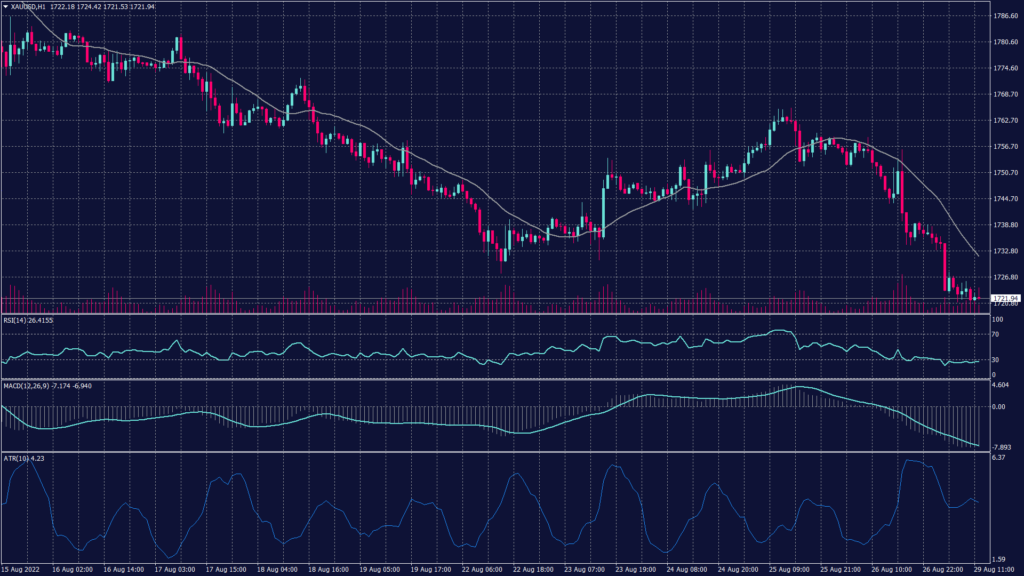
Gold prices sank to a one-month low on Monday following hawkish signals from the U.S. Federal Reserve. This week’s focus is on U.S. payrolls data due Friday, which could give the Fed even more space to raise rates. Spot gold prices slumped 0.7% to $1,726.06 an ounce, while gold futures sank 0.7% to $1,727.50 an ounce. Both instruments were trading around their weakest levels since late July.
Spot gold remains negative on both the daily and hourly time frames, but it shows a horizontal trend on the hourly chart. Meanwhile, the daily chart shows a sharper and clearer downtrend targeting levels near $1,700 per ounce.
PIVOT POINT: 1,723
| SUPPORT | RESISTANCE |
| 1,710 | 1,728 |
| 1,700 | 1,735 |
| 1,680 | 1,740 |
West Texas Crude (USOUSD)
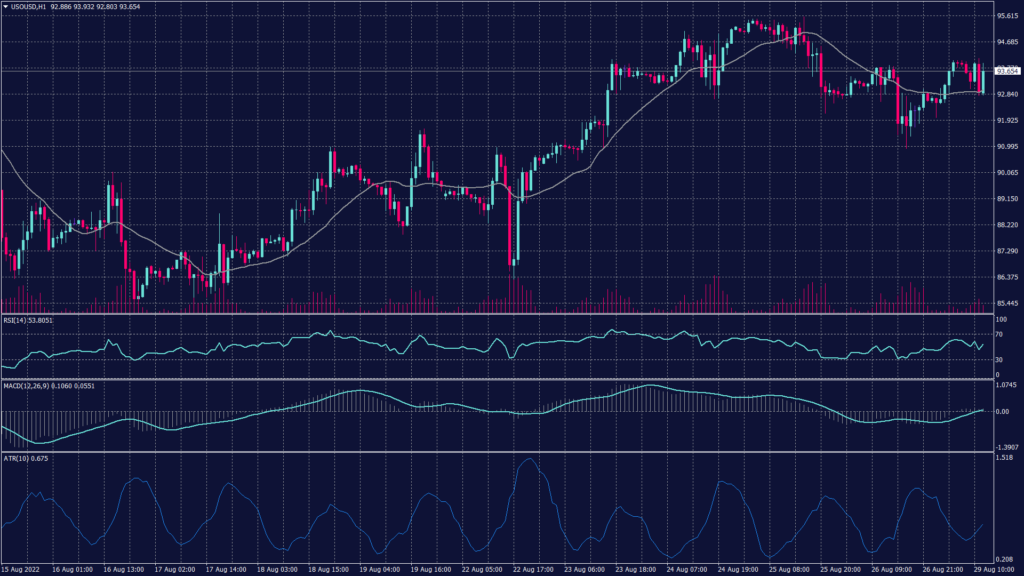
Oil prices inched higher on Monday as hopes of a supply cut by OPEC offset heightened concerns over an economic slowdown forecast by the U.S. Federal Reserve. Meanwhile, data showed the U.S. exported oil at a record pace earlier this month while pointing to a recovery in fuel demand. U.S. crude inventories have also fallen by a bigger-than-expected pace in the past two weeks.
In Asia, slowing economic growth in China could likely weigh on crude prices, given that the country is the world’s largest importer. Data last week showed that industrial activity in the country has been severely impacted by a series of COVID-19 lockdowns this year.
WTI rebounded from the support at 93.20 reaching above $94.50 per barrel and rising. However, the overall trend remains negative on the daily time frame unless prices broke above $96.20 per barrel which is the neckline of the double bottom on the daily chart.
PIVOT POINT: 93.50
| SUPPORT | RESISTANCE |
| 92.75 | 95.00 |
| 91.80 | 95.50 |
| 90.95 | 97.80 |
Tags
Open Live Account
Please enter a valid country
No results found
No results found
Please enter a valid email
Please enter a valid verification code
1. 8-16 characters + numbers (0-9) 2. blend of letters (A-Z, a-z) 3. special characters (e.g, !a#S%^&)
Please enter the correct format
Please tick the checkbox to proceed
Please tick the checkbox to proceed
Important Notice
STARTRADER does not accept any applications from Australian residents.
To comply with regulatory requirements, clicking the button will redirect you to the STARTRADER website operated by STARTRADER PRIME GLOBAL PTY LTD (ABN 65 156 005 668), an authorized Australian Financial Services Licence holder (AFSL no. 421210) regulated by the Australian Securities and Investments Commission.
CONTINUEImportant Notice for Residents of the United Arab Emirates
In alignment with local regulatory requirements, individuals residing in the United Arab Emirates are requested to proceed via our dedicated regional platform at startrader.ae, which is operated by STARTRADER Global Financial Consultation & Financial Analysis L.L.C.. This entity is licensed by the UAE Capital Market Authority (CMA) under License No. 20200000241, and is authorised to introduce financial services and promote financial products in the UAE.
Please click the "Continue" button below to be redirected.
CONTINUEError! Please try again.

