


Brent Technical Analysis
Oil is showing a healthy bullish continuation structure, following a strong recovery from the $58.95 low. Price has printed consistent higher lows and higher highs, with the market now consolidating just below $62.20 resistance. The 5, 10, and 30 moving averages are all aligned to the upside, and price remains above them, confirming that the short-term trend remains bullish despite the current pause.
MACD shows bullish momentum is slowing in the near term. This suggests oil may enter a short consolidation or shallow pullback. As long as price holds above $61.20–$60.80, the bullish bias remains intact, with potential for another upside attempt toward $62.50–$63.00. A break below the 30-period moving average would be the first technical signal that momentum is weakening.
Brent 1H Chart
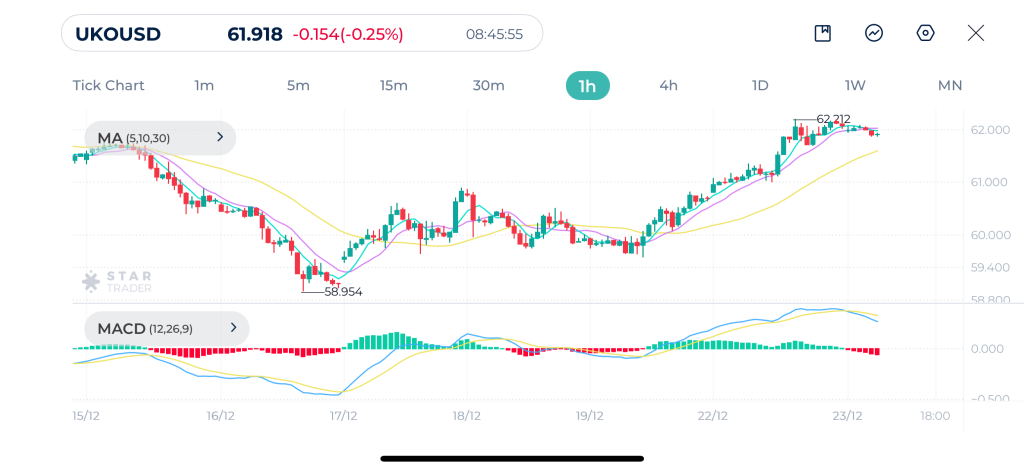
| Resistance | $61.70 | $62.15 | $62.64 |
| Support | $61.15 | $60.83 | $60.49 |
Gold Technical Analysis
Gold remains firmly in a strong bullish trend, with price pushing to fresh highs near the $4,500 psychological level. The structure is clearly defined by higher highs and higher lows, and price is trading above the 30-period moving average, which continues to act as dynamic support.
MACD remains positive, suggesting momentum is still bullish. As long as price holds above the $4,440–$4,425 support zone, the bias remains bullish, with potential for another leg higher. A clean break and hold above $4,500 would open the door for continuation.
Gold 1H Chart

| Resistance | $4,490 | $4,500 | $4,520 |
| Support | $4,448 | $4,421 | $4,405 |
Dow Jones Technical Analysis
Dow Jones is currently in a consolidation phase after a rebound, trading sideways between roughly 48,200 and 48,500 following a strong bounce from Friday’s low. Price is holding above the 30-period moving average, which has flattened slightly but still provides underlying support.
MACD lines are flattening near the zero line. As long as index holds above 48,000–47,850, the broader structure remains constructive, and a break above 48,550–48,800 could trigger renewed upside momentum. However, failure to hold above the 30-period moving average would increase the risk of a deeper pullback toward previous demand near 47,600–47,400.
Dow Jones 1H Chart
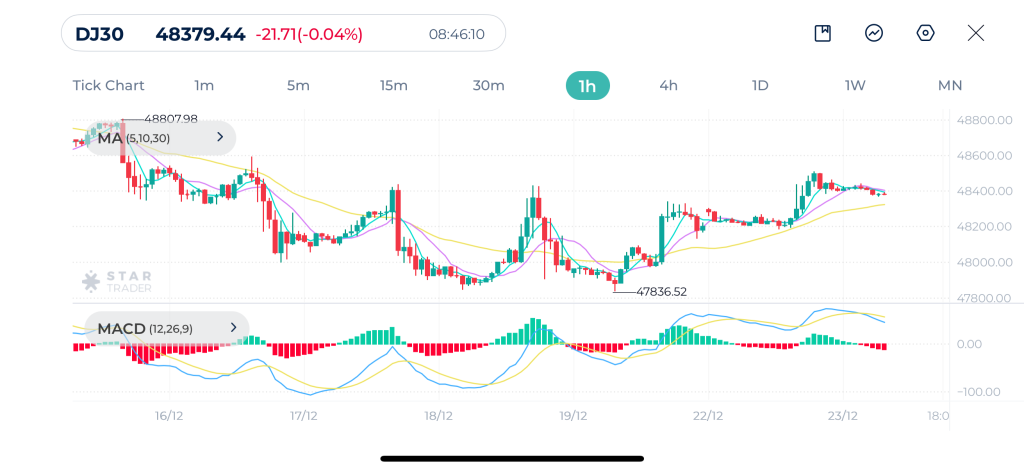
| Resistance | 48,454 | 48,520 | 48,673 |
| Support | 48,235 | 48,130 | 48,039 |
Tags
Open Live Account
Please enter a valid country
No results found
No results found
Please enter a valid email
Please enter a valid verification code
1. 8-16 characters + numbers (0-9) 2. blend of letters (A-Z, a-z) 3. special characters (e.g, !a#S%^&)
Please enter the correct format
Please tick the checkbox to proceed
Please tick the checkbox to proceed
Important Notice
STARTRADER does not accept any applications from Australian residents.
To comply with regulatory requirements, clicking the button will redirect you to the STARTRADER website operated by STARTRADER PRIME GLOBAL PTY LTD (ABN 65 156 005 668), an authorized Australian Financial Services Licence holder (AFSL no. 421210) regulated by the Australian Securities and Investments Commission.
CONTINUEImportant Notice for Residents of the United Arab Emirates
In alignment with local regulatory requirements, individuals residing in the United Arab Emirates are requested to proceed via our dedicated regional platform at startrader.ae, which is operated by STARTRADER Global Financial Consultation & Financial Analysis L.L.C.. This entity is licensed by the UAE Capital Market Authority (CMA) under License No. 20200000241, and is authorised to introduce financial services and promote financial products in the UAE.
Please click the "Continue" button below to be redirected.
CONTINUEError! Please try again.

