


EURUSD Technical Analysis
EURUSD is currently trading in a short-term consolidation phase on the 1H timeframe. The pair managed to break above the 1.1700 level, signaling renewed buying interest, but upward momentum has slowed as price consolidates below the 1.1760 resistance zone. This sideways movement reflects market indecision, especially as price remains above the 30-period moving average, which continues to provide dynamic support.
A confirmed break above the 1.1760 level would likely trigger bullish continuation toward the 1.1800 region, while a failure to hold above 1.1720 could lead to a deeper pullback toward 1.1680–1.1700.
EURUSD 1H Chart
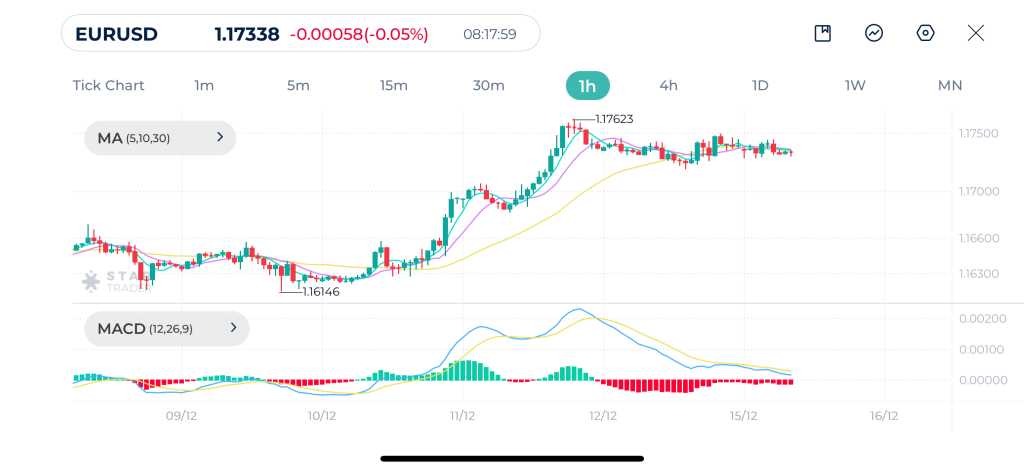
| Resistance | 1.1749 | 1.1762 | 1.1786 |
| Support | 1.1719 | 1.1705 | 1.1682 |
Gold Technical Analysis
Gold remains strongly bullish on the 4H timeframe, continuing to trade within a strong medium-term uptrend supported by aggressive buying interest. Price has successfully broken above the $4,300 resistance level, confirming bullish control and reinforcing the broader trend. All major moving averages are aligned to the upside and sloping higher, with price trading above the 30-period moving average. This structure highlights strong trend health, as pullbacks have remained limited.
As long as gold holds above the $4,300 support level, any short-term declines are likely to be corrective in nature rather than trend-changing. A sustained break above the $4,380–$4,400 zone could open the door for another impulsive move toward new all-time highs, while a drop back below the $4,180–$4,200 region would signal a meaningful shift in trend.
Gold 4H Chart
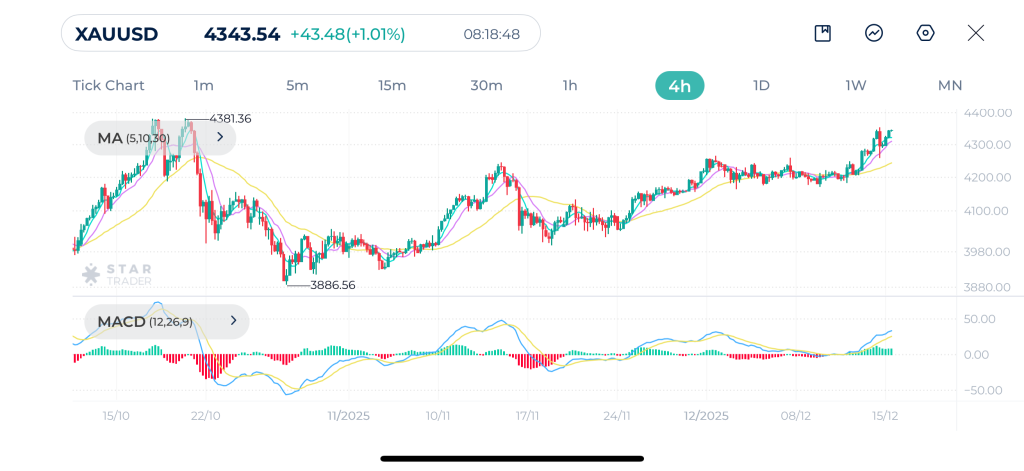
| Resistance | $4,353 | $4,381 | $4,400 |
| Support | $4,319 | $4,300 | $4,285 |
Dow Jones Technical Analysis
The Dow Jones continues to trade within a clearly bullish structure on the 1H timeframe, with price maintaining higher highs and higher lows. After the strong rally toward the 48,960 peak, the market has entered a short-term consolidation phase.
Despite the pullback from recent highs, price remains above the 30-period moving average, which continues to act as dynamic support. The short-term moving averages have flattened after the correction and are showing early signs of turning higher.
As long as the index holds above the 48,500 area, the bullish bias remains intact, with a potential renewed push toward the 48,950–49,000 resistance zone. A break below 47,950 would be needed to shift the outlook toward a deeper corrective phase.
Dow Jones 1H Chart
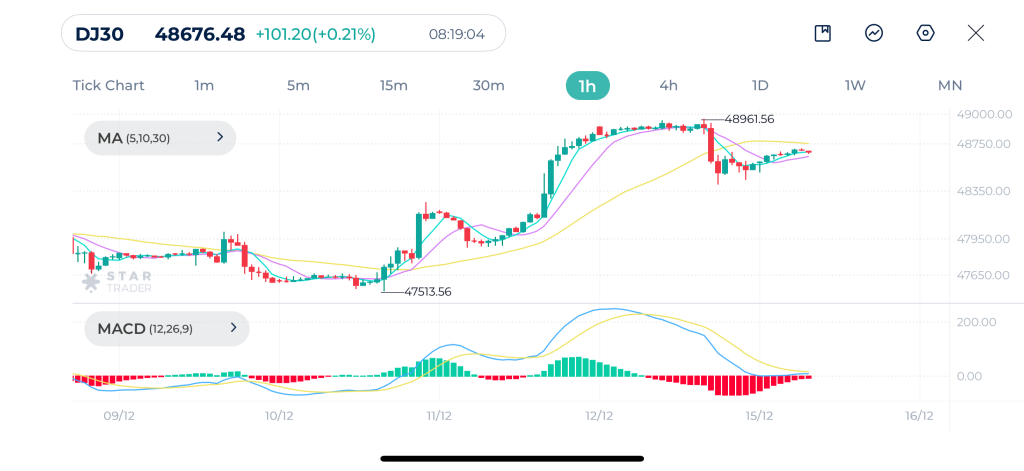
| Resistance | 48,652 | 48,774 | 48,880 |
| Support | 48,424 | 48,332 | 48,180 |
Tags
Open Live Account
Please enter a valid country
No results found
No results found
Please enter a valid email
Please enter a valid verification code
1. 8-16 characters + numbers (0-9) 2. blend of letters (A-Z, a-z) 3. special characters (e.g, !a#S%^&)
Please enter the correct format
Please tick the checkbox to proceed
Please tick the checkbox to proceed
Important Notice
STARTRADER does not accept any applications from Australian residents.
To comply with regulatory requirements, clicking the button will redirect you to the STARTRADER website operated by STARTRADER PRIME GLOBAL PTY LTD (ABN 65 156 005 668), an authorized Australian Financial Services Licence holder (AFSL no. 421210) regulated by the Australian Securities and Investments Commission.
CONTINUEImportant Notice for Residents of the United Arab Emirates
In alignment with local regulatory requirements, individuals residing in the United Arab Emirates are requested to proceed via our dedicated regional platform at startrader.ae, which is operated by STARTRADER Global Financial Consultation & Financial Analysis L.L.C.. This entity is licensed by the UAE Capital Market Authority (CMA) under License No. 20200000241, and is authorised to introduce financial services and promote financial products in the UAE.
Please click the "Continue" button below to be redirected.
CONTINUEError! Please try again.

