


Ethereum Technical Analysis
The crypto market as a whole is gaining momentum and attraction. Ethereum has been steadily climbing from below $3,300 to above $4,680 since the beginning of the month, with the three moving averages in perfect bullish order and wide separation, a sign of a strong trend. The MACD remains strongly positive, though the histogram is shrinking, hinting at possible consolidation after the strong push.
Eyes on the all-time high that Ether reached in 2021 at $4,867
ETHUSD 1H Chart
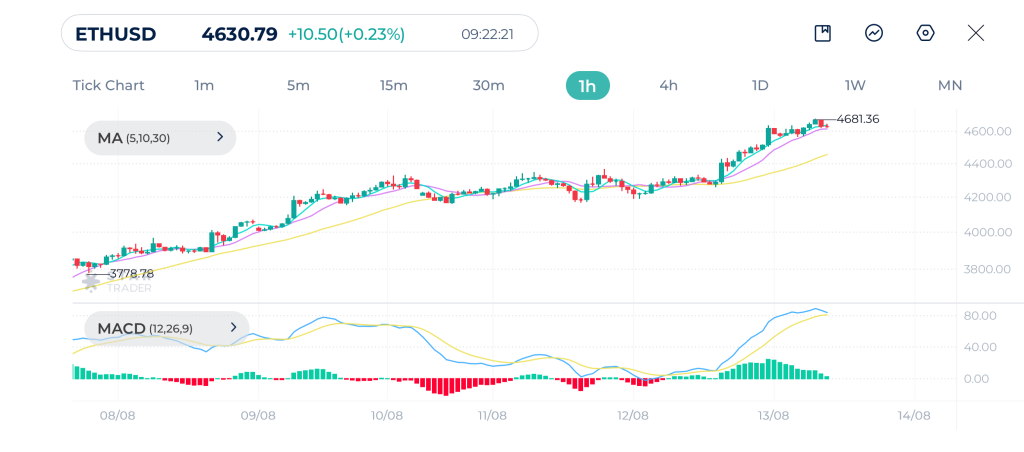
| Resistance | $4,763 | $4,866 | $5,000 |
| Support | $4,564 | $4,517 | $4,479 |
EURUSD Technical Analysis
EURUSD shows a strong uptrend on the hourly chart with higher highs and higher lows. The price is now consolidating near the highs. The short-term moving averages (MA 5 and 10) are above the longer-term moving average MA(30), suggesting bullish momentum.
The MACD is positive, though it is shrinking, which hints at slowing momentum and the potential for a short-term pullback or sideways movement before the next leg upward. A breakout above 1.1700 opens the door for more gains toward 1.1770
EURUSD 1H Chart
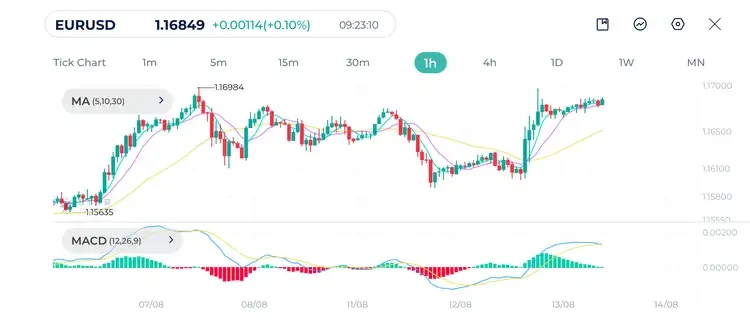
| Resistance | 1.1697 | 1.1734 | 1.1763 |
| Support | 1.1670 | 1.1652 | 1.1631 |
S&P500 Technical Analysis
US indices continue to climb and reach record highs. S&P500 shows a clear uptrend with higher highs and higher lows. The moving averages MA(5), MA(10), and MA(30) are in bullish alignment, and price is currently moving at the short-term moving averages.
The MACD is above zero line, but flattening, which means buying pressure may be stabilizing rather than accelerating. This often happens after a sharp rally before a new directional move.
As long as the index remains above 6,438, uptrend remains intact.
S&P500 1H Chart
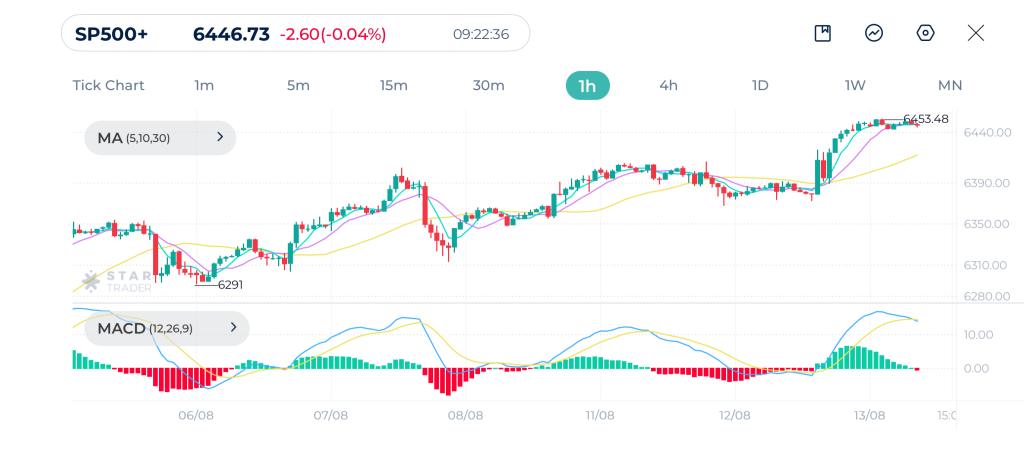
| Resistance | 6,449 | 6,501 | 6,541 |
| Support | 6,438 | 6,425 | 6,409 |
Tags
Open Live Account
Please enter a valid country
No results found
No results found
Please enter a valid email
Please enter a valid verification code
1. 8-16 characters + numbers (0-9) 2. blend of letters (A-Z, a-z) 3. special characters (e.g, !a#S%^&)
Please enter the correct format
Please tick the checkbox to proceed
Please tick the checkbox to proceed
Important Notice
STARTRADER does not accept any applications from Australian residents.
To comply with regulatory requirements, clicking the button will redirect you to the STARTRADER website operated by STARTRADER PRIME GLOBAL PTY LTD (ABN 65 156 005 668), an authorized Australian Financial Services Licence holder (AFSL no. 421210) regulated by the Australian Securities and Investments Commission.
CONTINUEImportant Notice for Residents of the United Arab Emirates
In alignment with local regulatory requirements, individuals residing in the United Arab Emirates are requested to proceed via our dedicated regional platform at startrader.ae, which is operated by STARTRADER Global Financial Consultation & Financial Analysis L.L.C.. This entity is licensed by the UAE Capital Market Authority (CMA) under License No. 20200000241, and is authorised to introduce financial services and promote financial products in the UAE.
Please click the "Continue" button below to be redirected.
CONTINUEError! Please try again.

