


Gold Technical Analysis
Gold continues to show exceptional bullish momentum on the 1-hour timeframe after breaking above the previous consolidation zone near $4,700. Price is currently trading near $4,750 after a sharp impulsive rally. The moving averages are in a perfect bullish alignment, with MA5 above MA10 and both comfortably above the MA20, while all three averages are sloping upward.
From a technical perspective, the $4,700-$4,685 region is now the key support zone to watch. As long as price remains above that area, the bullish structure remains firmly intact. A sustained break above $4,750 could trigger another momentum expansion toward higher resistance levels around $4,770 and potentially $4,800. On the downside, only a strong rejection followed by a move back below 4685 would suggest weakening momentum and open the door for a deeper corrective pullback.
Gold 1H Chart
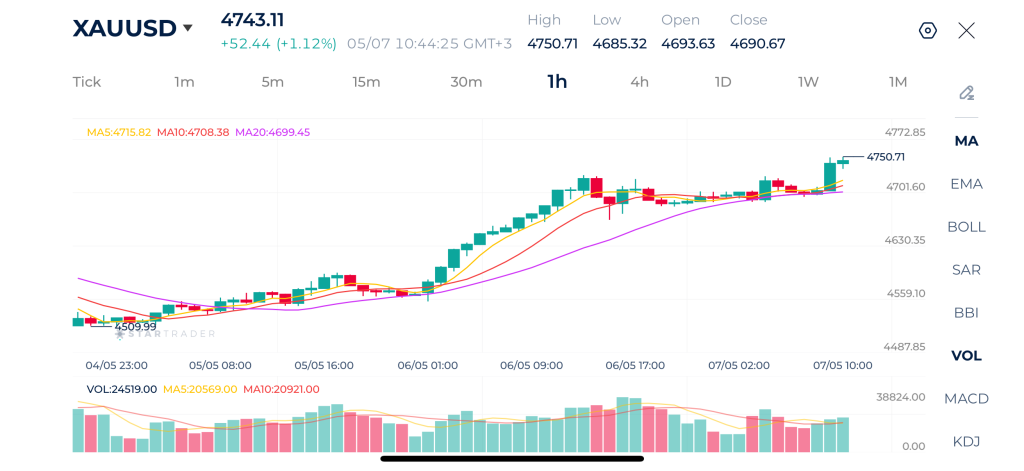
| Resistance | $4,750 | $4,800 | $4,845 |
| Support | $4,691 | $4,660 | $4,640 |
Brent Technical Analysis
Oil remains under intense bearish pressure after completely failing to recover from the earlier rejection near $120. The breakdown below the $110 support zone accelerated bearish momentum significantly and triggered a sharp sell-off toward the $101 area. Although price attempted to stabilize temporarily around $104-$105, sellers quickly regained control and pushed the market lower again.
The moving averages strongly support the bearish outlook. Price is trading below the MA5, MA10, and MA20, while all three averages are sloping downward, confirming sustained downside momentum.
The $104.50-$105.00 area is now an important resistance zone. As long as price remains below it, the bearish trend remains dominant. A continuation lower could expose the previous low near $101 and potentially psychological support around $100.
Brent 1H Chart
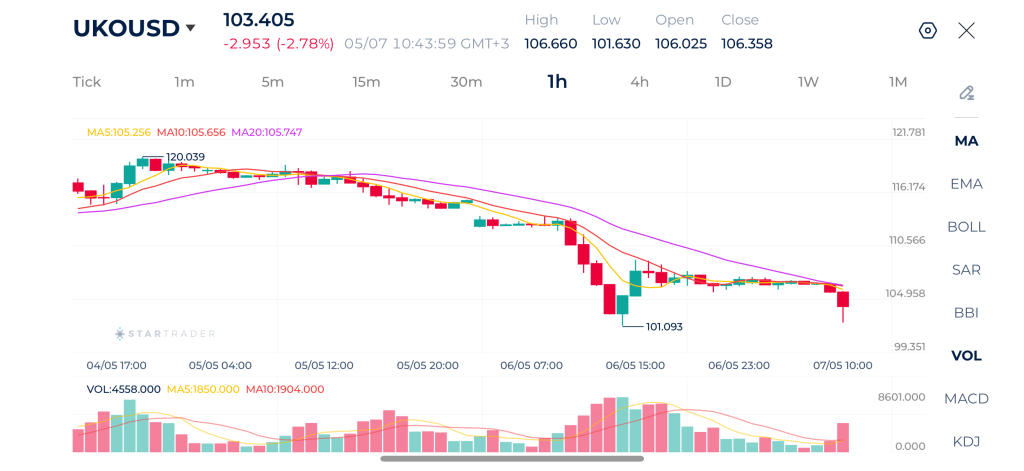
| Resistance | $104.65 | $106.88 | $109.21 |
| Support | $101.09 | $100.00 | $98.26 |
S&P 500 Technical Analysis
The S&P500 maintains a very clean bullish structure. The recent move has developed through controlled bullish continuation, where pullbacks remain shallow and buyers consistently defend support zones.
Price is currently testing the $7,390 region after breaking above several prior resistance levels. The moving averages confirm the strength of the trend, with the MA5 leading above the MA10 and both staying above the rising MA20.
Momentum remains bullish unless price falls back below the $7,360-$7,350 support region. That area now acts as a key short-term demand zone and aligns with the moving averages. If buyers maintain control above this level, the market could continue extending toward fresh highs beyond 7,400. A breakdown below the MA20 would be the first meaningful warning sign of weakening momentum, but currently the overall structure still strongly favors continuation to the upside.
S&P 500 1H Chart
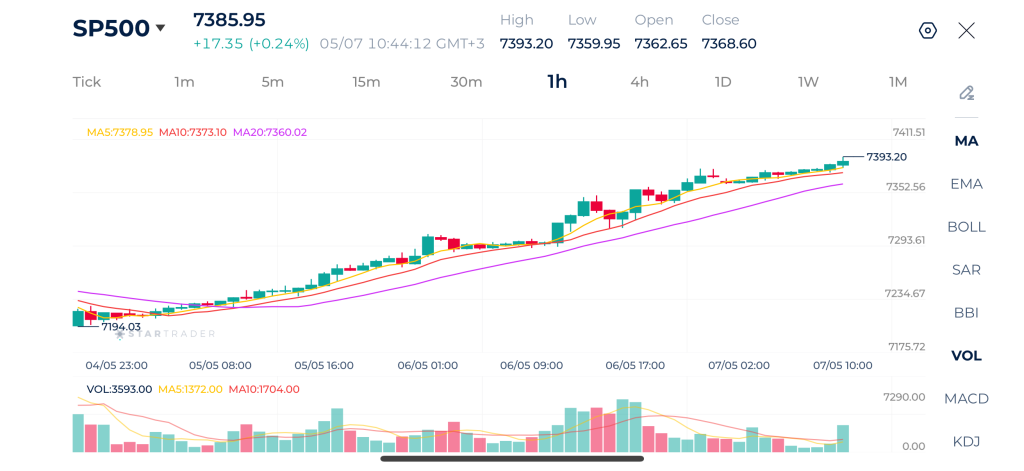
| Resistance | 7,390 | 7,400 | 7,425 |
| Support | 7,364 | 7,344 | 7,325 |
Risk Disclaimer: This material is provided for informational purposes only and does not constitute a recommendation or investment advice. Trading financial instruments on margin involves substantial risk and may not be appropriate for all investors.
Tags
Open Live Account
Please enter a valid country
No results found
No results found
Please enter a valid email
Please enter a valid verification code
1. 8-16 characters + numbers (0-9) 2. blend of letters (A-Z, a-z) 3. special characters (e.g, !a#S%^&)
Please enter the correct format
Please tick the checkbox to proceed
Please tick the checkbox to proceed
Important Notice
STARTRADER does not accept any applications from Australian residents.
To comply with regulatory requirements, clicking the button will redirect you to the STARTRADER website operated by STARTRADER PRIME GLOBAL PTY LTD (ABN 65 156 005 668), an authorized Australian Financial Services Licence holder (AFSL no. 421210) regulated by the Australian Securities and Investments Commission.
CONTINUEImportant Notice for Residents of the United Arab Emirates
In alignment with local regulatory requirements, individuals residing in the United Arab Emirates are requested to proceed via our dedicated regional platform at startrader.ae, which is operated by STARTRADER Global Financial Consultation & Financial Analysis L.L.C.. This entity is licensed by the UAE Capital Market Authority (CMA) under License No. 20200000241, and is authorised to introduce financial services and promote financial products in the UAE.
Please click the "Continue" button below to be redirected.
CONTINUEError! Please try again.

