


As the Bank of Japan steps into currency markets for the first time in decades to defend a battered yen, it is running into numerous obstacles, chiefly its stubborn commitment to ultra-easy monetary settings. Thursday’s sudden burst of yen-buying intervention by Japanese authorities — the first instance since 1998 – caused a large 6 yen move between 140 and 146 in the dollar-yen exchange rate.
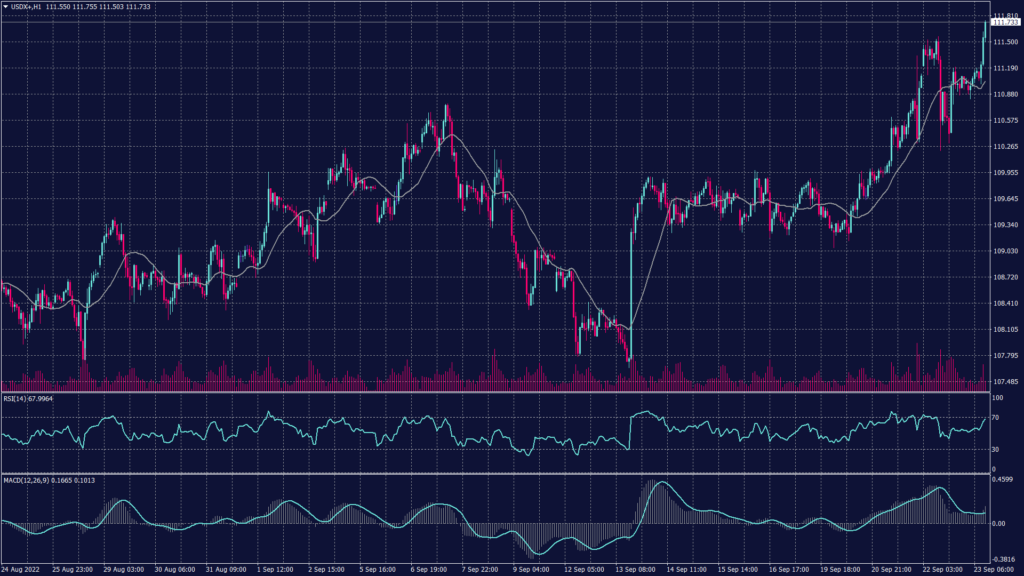
U.S. Dollar Index (USDX)
The U.S. dollar edged higher in early European trading Friday, remaining in demand after the Federal Reserve’s hawkish stance, while the yen was buoyant after the intervention of Japanese authorities.
The Dollar Index, which tracks the greenback against a basket of six other currencies, edged 0.1% higher to 111.248, just below the two-decade high of 111.81 it hit in the previous session.
The index gained further momentum on both the daily and hourly charts, which built higher support. The daily chart shows support at 109.90 and 110.50 confirmed by the readings of the moving averages and MACD. Meanwhile, the hourly chart shows additional support levels between the current and daily levels at 111.30 and 111.05.
Pivot Point: 111.80
| SUPPORT | RESISTANCE |
| 111.30 | 112.20 |
| 111.05 | 113.00 |
| 110.85 | 113.20 |
Euro (EURUSD)
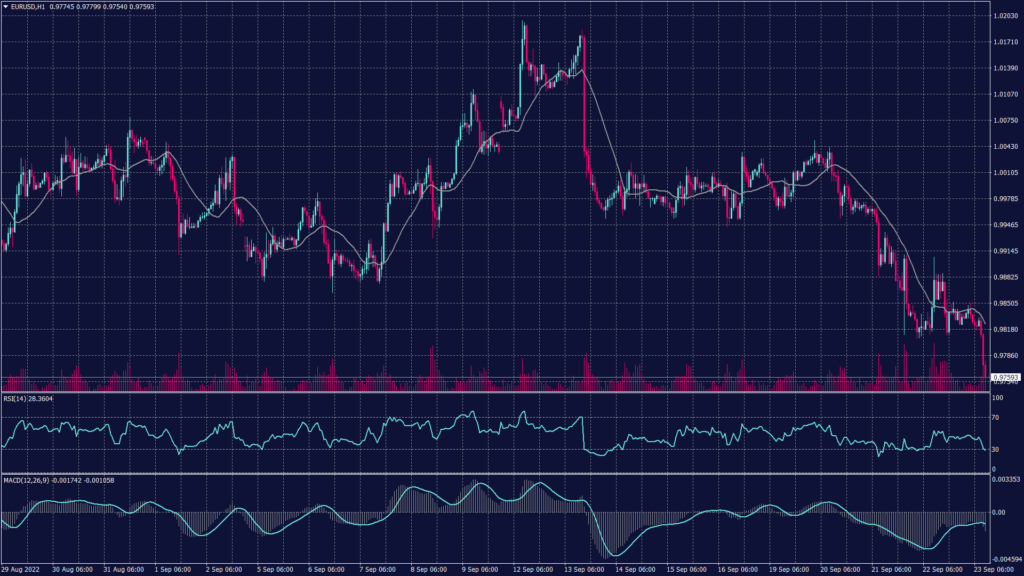
EURUSD fell 0.2% to 0.9813, not far removed from the 20-year low of 0.9807 hits overnight. Flash September purchasing managers’ indexes for the Eurozone are due later in the session and are likely to illustrate the darkening regional economic outlook.
The daily chart is showing heavy pressure below the parity levels and confirms the downtrend towards 0.9630. The hourly chart signals further decline with no strong support.
Pivot Point: 0.9750
| SUPPORT | RESISTANCE |
| 0.9710 | 0.9800 |
| 0.9630 | 0.9810 |
| 0.9590 | 0.9860 |
Japanese Yen (USDJPY)
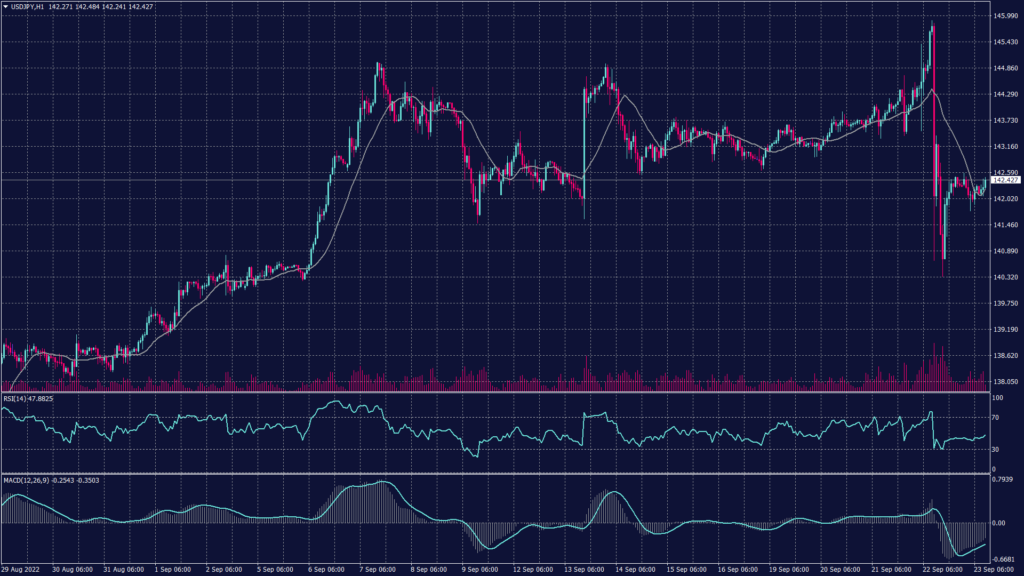
USDJPY fell 0.1% to 142.28 against the greenback. The samurai currency continued to fall after a drop of more than 1% on Thursday after Japanese authorities intervened in markets to support the yen for the first time since 1998.
The intervention followed the decision of the Bank of Japan to maintain its ultra-easy monetary policy. This provided a direct contrast to the stance taken by the Federal Reserve on Wednesday when the U.S. central bank lifted rates by 75 basis points and signaled that its interest rates will climb higher and stay elevated for longer than the markets had previously priced in.
Pivot Point: 142.70
| SUPPORT | RESISTANCE |
| 141.95 | 143.50 |
| 141.15 | 144.30 |
| 140.35 | 145.10 |
Spot Gold (XAUUSD)
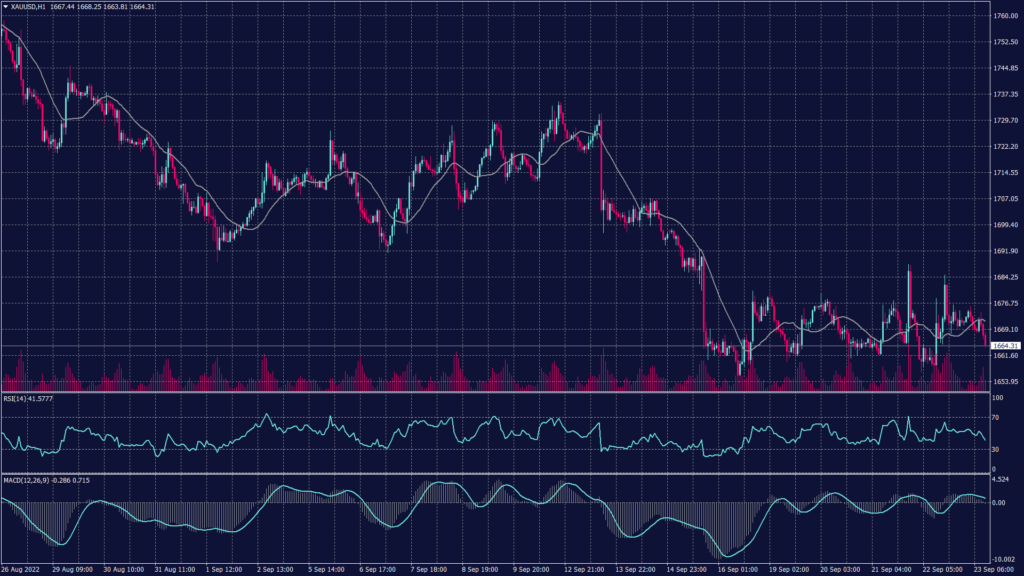
Gold prices steadied on Friday and were set to end the week largely unchanged as selling pressure from a hawkish Federal Reserve appeared to have eased. Bullion prices showed surprising resilience this week after the Fed hiked rates and struck a more hawkish tone than many were expecting, with U.S. interest rates now set to end the year well above 4%.
Spot gold was largely unchanged at around $1,672.37 an ounce, while gold futures held around $1,680 an ounce. Resilience in prices also came as the dollar retreated slightly from a fresh 20-year peak hit on Thursday.
Technically, the precious metal remains under selling pressure below $1,665 per ounce on the hourly chart. However, technical indicators show a possibility of fluctuation and a slight rebound to 1,665 during the European session.
Pivot Point: 1,663
| SUPPORT | RESISTANCE |
| 1,659 | 1,670 |
| 1,654 | 1,675 |
| 1,625 | 1,678 |
West Texas Crude (USOUSD)
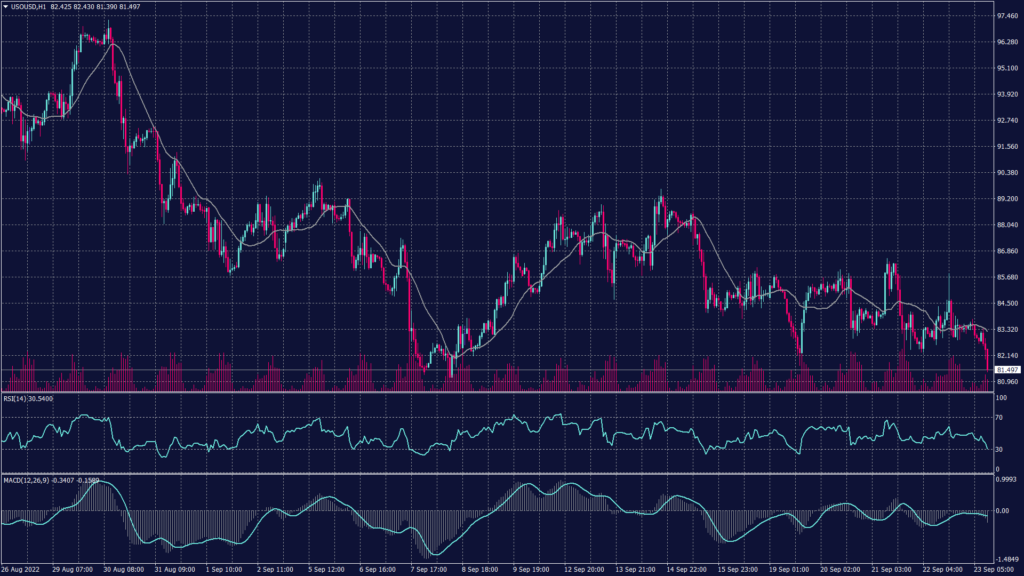
Oil prices fell on Friday amid recession fears and a stronger U.S. dollar, though losses were capped by supply concerns after Moscow’s new mobilization campaign in its war with Ukraine and an apparent deadlock in talks on reviving the Iran nuclear deal. Brent crude futures fell 0.5% to $90.00 per barrel, while WTI crude futures were also down 0.55% to $83.03.
WTI is moving in a slow fashion that might lead to a horizontal trend below $83 per barrel. However, technical indicators show neutral signals, but price action shows a tendency for negative movement.
Pivot Point: 81.65
| SUPPORT | RESISTANCE |
| 81.00 | 83.50 |
| 80.70 | 84.70 |
| 80.10 | 85.95 |
Tags
Open Live Account
Please enter a valid country
No results found
No results found
Please enter a valid email
Please enter a valid verification code
1. 8-16 characters + numbers (0-9) 2. blend of letters (A-Z, a-z) 3. special characters (e.g, !a#S%^&)
Please enter the correct format
Please tick the checkbox to proceed
Please tick the checkbox to proceed
Important Notice
STARTRADER does not accept any applications from Australian residents.
To comply with regulatory requirements, clicking the button will redirect you to the STARTRADER website operated by STARTRADER PRIME GLOBAL PTY LTD (ABN 65 156 005 668), an authorized Australian Financial Services Licence holder (AFSL no. 421210) regulated by the Australian Securities and Investments Commission.
CONTINUEImportant Notice for Residents of the United Arab Emirates
In alignment with local regulatory requirements, individuals residing in the United Arab Emirates are requested to proceed via our dedicated regional platform at startrader.ae, which is operated by STARTRADER Global Financial Consultation & Financial Analysis L.L.C.. This entity is licensed by the UAE Capital Market Authority (CMA) under License No. 20200000241, and is authorised to introduce financial services and promote financial products in the UAE.
Please click the "Continue" button below to be redirected.
CONTINUEError! Please try again.

