


market news summary
U.S. Dollar Index (USDX)
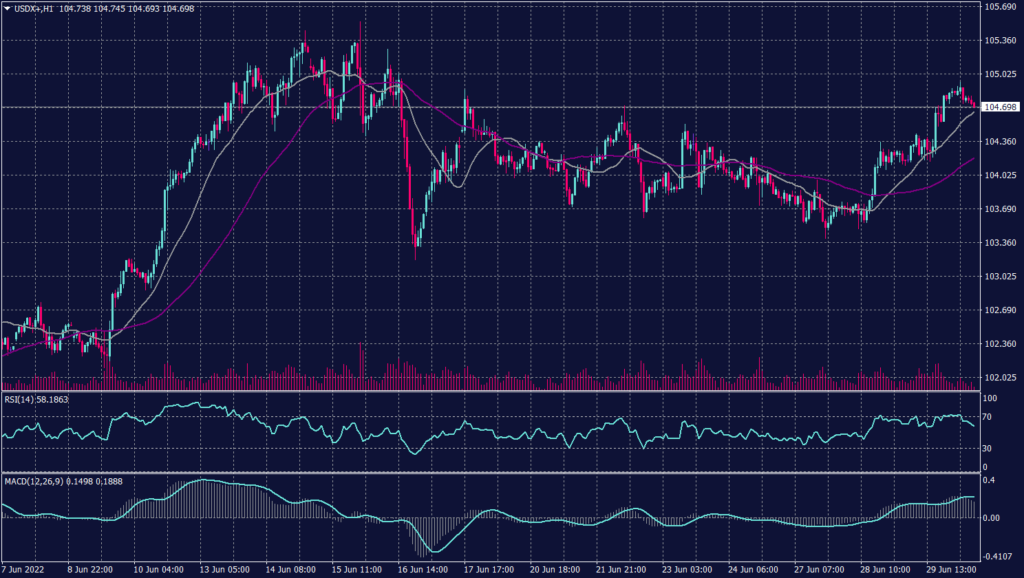
The dollar was down on Thursday morning in Asia, after central bank chiefs signaled a resolution to bring down inflation. The U.S. Dollar Index that tracks the greenback against a basket of other currencies inched down 0.06% to 105.04.
U.S. Federal Reserve Chair Jerome Powell and his European and U.K. counterparts warned that inflation could be long-lasting during the European Central Bank (ECB)’ s annual forum in Portugal. He added that it was important to bring down inflation.
Technically:
The daily chart indicates a continuation of the uptrend in the long term under the condition of holding above 104. Technical indicators can’t confirm the continuation while moving averages show horizontal signals. The hourly chart shows an upward movement but keeps the tendency for a decline.
PIVOT POINT: 104.60
| SUPPORT | RESISTANCE |
| 103.50 | 104.80 |
| 102.60 | 105.10 |
| 102.30 | 105.60 |
Euro (EURUSD)
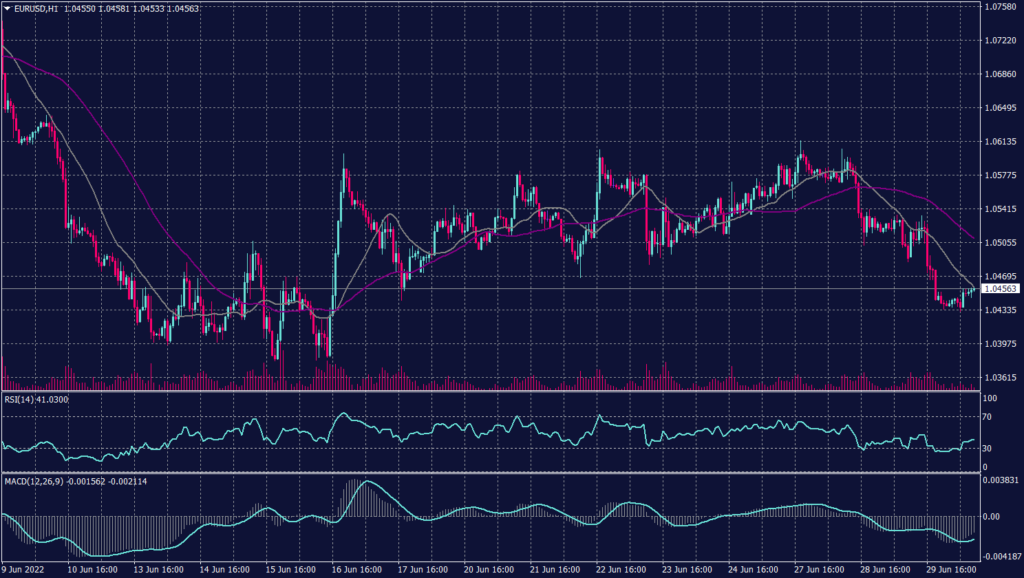
The Euro pair remains drowning overall despite the support above 1.0400. Meanwhile, on the hourly chart, the EURUSD traded upwards this morning bouncing from two weeks low.
The pair show shows for decline continuation towards 1.0375 and technical indicators confirm the signal.
PIVOT POINT:1.0460
| SUPPORT | RESISTANCE |
| 1.0375 | 1.0580 |
| 1.0280 | 1.0630 |
| 1.0110 | 1.0690 |
Chinese Yuan (USDCNH)
China’s factory activity expanded for the first time in four months as lockdowns ended in major cities such as Shanghai. Official data released earlier in the day showed that the manufacturing purchasing managers’ index (PMI) rose to 50.2 in June from 49.6 in May, the first expansion since February.
Meanwhile, President Xi Jingping said zero COVID is still the most “economic and effective” policy for China although the country just slashed COVID quarantine time for inbound travellers.
Technically:
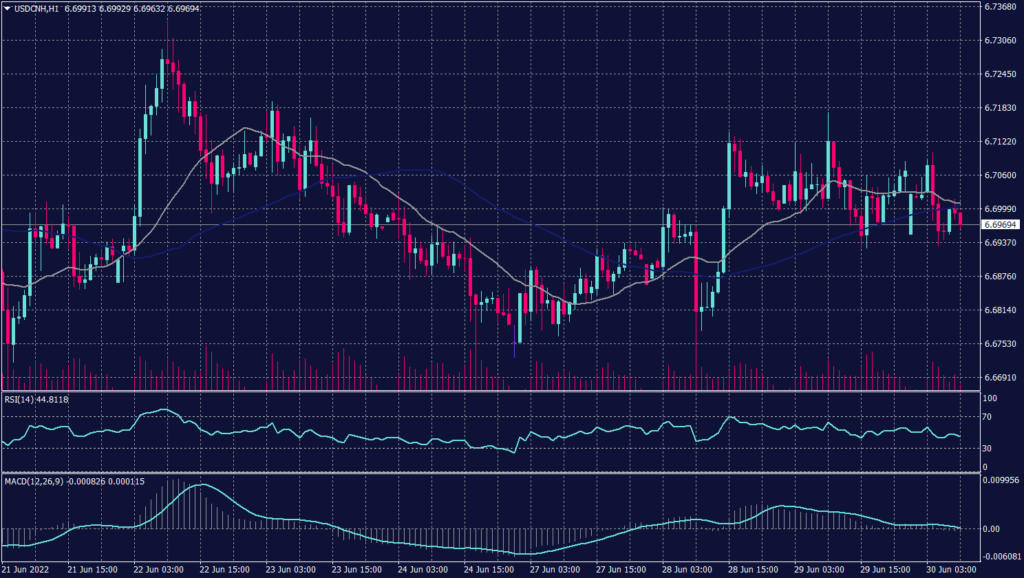
The Chinese yuan pair trading in a horizontal range between both the strong support at 6.650 and the stubborn support at 6.750. Both the hourly chart and the daily chart show a continuation of the horizontal trend within the current channel.
Technical indicators signal a possibility of a decline, but the condition is breaking below 6.65 where Moving averages are forming a strong support.
PIVOT POINT: 6.700
| SUPPORT | RESISTANCE |
| 6.6900 | 6.7100 |
| 6.6850 | 6.7210 |
| 6.6620 | 6.7320 |
Spot Gold (XAUUSD)
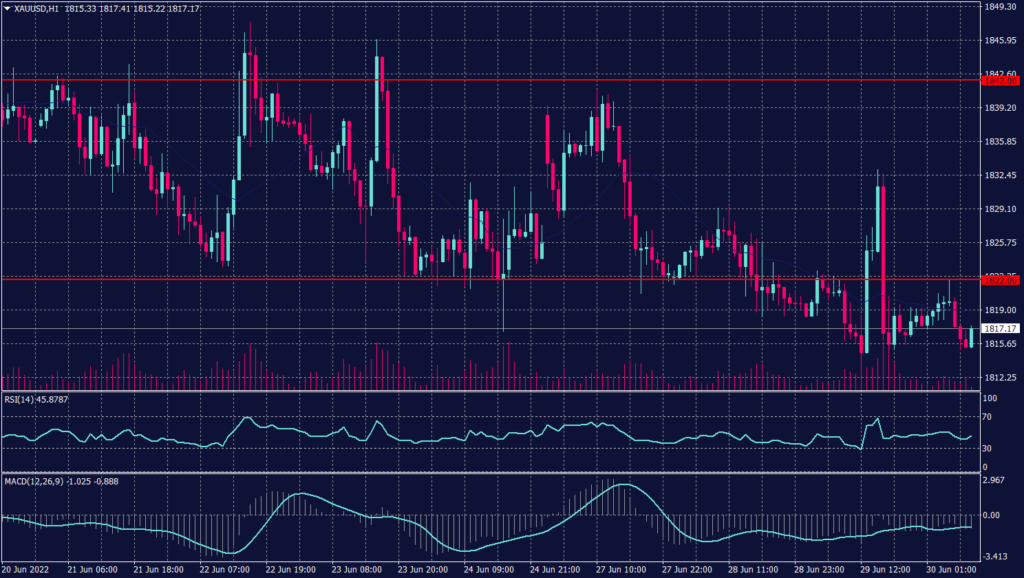
Gold was up 0.04% to 1,821.95 this morning in Asia, supported by recession concerns as U.S. 10-year Treasury yields eased. Bullion was caught between pressure from prospects of higher interest rates and support from recession risks. Moreover, the U.S. Consumer Confidence Index fell to a 16-month low in June as high inflation left consumers to worry about a slowing economy.
The U.S. banned new imports of Russian gold, acting on commitments made by the Group of Seven leaders this week to further punish Russia over its invasion of Ukraine.
Technically:
Gold broke below the support at 1,820 which confirms a drop towards 1,800. Meanwhile, technical indicators remain neutral and the 20-period moving average is positive above 1,825. The daily chart, however, shows a horizontal trend and an increased possibility of a decline between 1,810 and 1,800.
PIVOT POINT: 1,810
| SUPPORT | RESISTANCE |
| 1,800 | 1,820 |
| 1,790 | 1,822 |
| 1,788 | 1,837 |
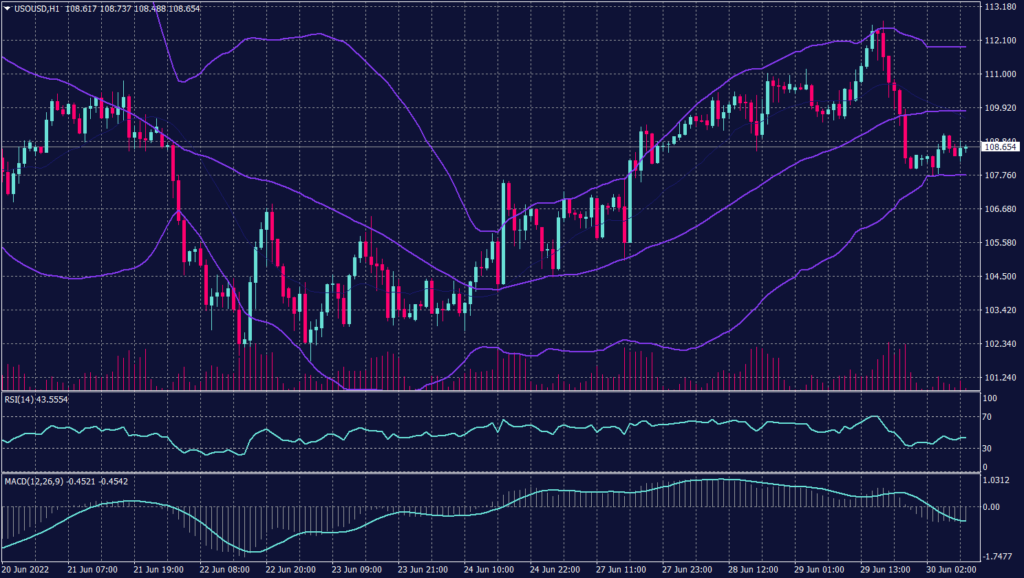
West Texas Crude (USOUSD)
Oil prices edged higher on Thursday after dipping in early Asian trade, as concerns about global supply tightness outweighed a build in U.S. gasoline and distillate inventories. Fuel stocks rose as refiners ramped up activity, operating at 95% of capacity, the highest for this time of year in four years. Brent crude futures rose 0.6% to $113.08 a barrel, WTI crude futures climbed 0.5% to $110.27.
However, concerns over slowing economic growth continued to cap price gains. Meanwhile, the OPEC+ group, which includes allies such as Russia, began two days of meetings on Wednesday, though sources said there was little prospect of pumping more oil.
Technically:
On the hourly chart, WTI prices show a decrease in volume traded due to the worries about the G-7 decision regarding the Russian sanctions. Meanwhile, WTI shows a corrective movement bouncing from $104 to the resistance of $109.80.
However, the daily chart confirms the high probability of the decline and targets $98 a barrel before any serious gains happens.
PIVOT POINT: 108.10
| SUPPORT | RESISTANCE |
| 104.50 | 110.00 |
| 102.20 | 112.30 |
| 100.00 | 114.00 |
Tags
Open Live Account
Please enter a valid country
No results found
No results found
Please enter a valid email
Please enter a valid verification code
1. 8-16 characters + numbers (0-9) 2. blend of letters (A-Z, a-z) 3. special characters (e.g, !a#S%^&)
Please enter the correct format
Please tick the checkbox to proceed
Please tick the checkbox to proceed
Important Notice
STARTRADER does not accept any applications from Australian residents.
To comply with regulatory requirements, clicking the button will redirect you to the STARTRADER website operated by STARTRADER PRIME GLOBAL PTY LTD (ABN 65 156 005 668), an authorized Australian Financial Services Licence holder (AFSL no. 421210) regulated by the Australian Securities and Investments Commission.
CONTINUEImportant Notice for Residents of the United Arab Emirates
In alignment with local regulatory requirements, individuals residing in the United Arab Emirates are requested to proceed via our dedicated regional platform at startrader.ae, which is operated by STARTRADER Global Financial Consultation & Financial Analysis L.L.C.. This entity is licensed by the UAE Capital Market Authority (CMA) under License No. 20200000241, and is authorised to introduce financial services and promote financial products in the UAE.
Please click the "Continue" button below to be redirected.
CONTINUEError! Please try again.

