


Market News Summary
Euro continues the fall;
Swiss Franc at new low;
Gold is supported at 1,900.
Euro (EURUSD)
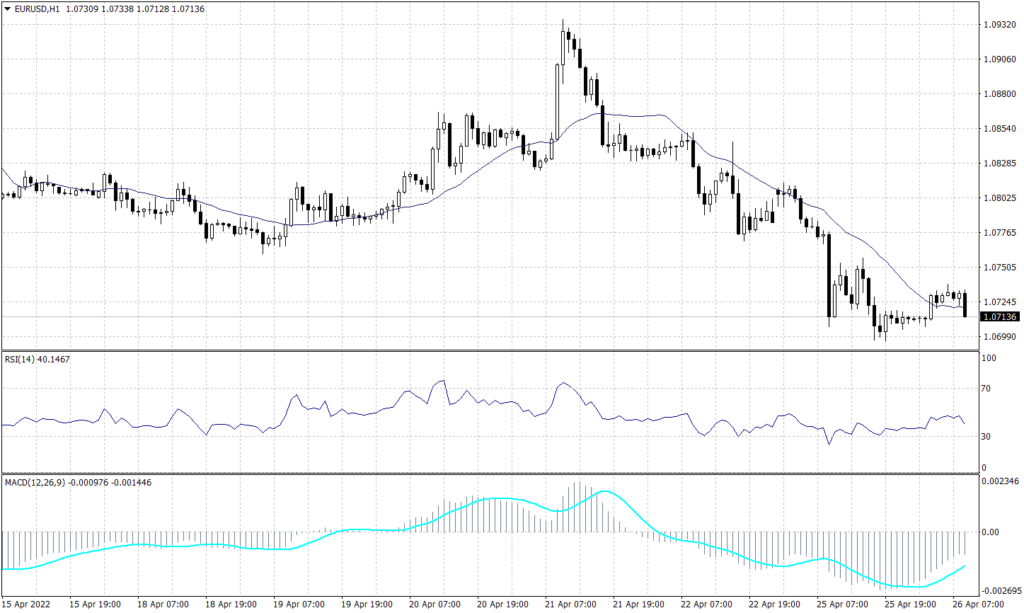
On the daily chart of the Euro, the overall trend remains bearish. Similarly, the price is currently intersecting the negative trend line and the level of 1.0725 on the hourly chart, indicating a significant downturn. The RSI and MACD both imply price continuation to the downside.
PIVOT POINT: 1.0725
| R1 | R2 | R3 | |
| RESISTANCE | 1.0760 | 1.0780 | 1.0810 |
| S1 | S2 | S3 | |
| SUPPORT | 1.0710 | 1.0670 | 1.0640 |
Swiss Franc (USDCHF)
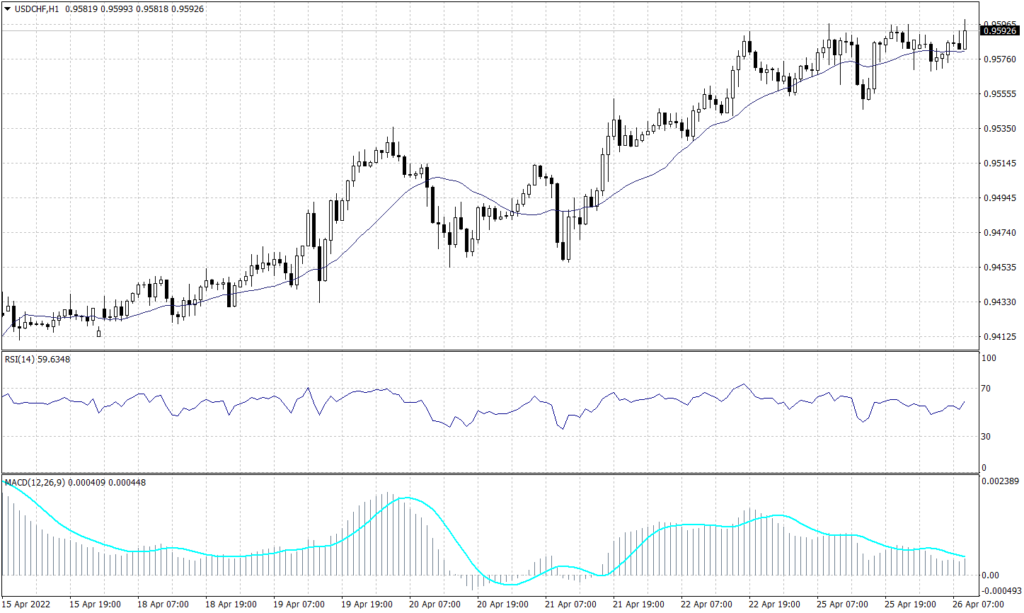
The overall trend of the Swiss Franc price in the daily time frame is bullish. Similarly, pricing has produced a succession of higher highs in the hourly time frame, indicating that prices will continue to rise. Although the price is now stabilizing at 0.9590, the RSI and MACD technical indicators suggest no clear trend.
PIVOT POINT: 0.9590
| R1 | R2 | R3 | |
| RESISTANCE | 0.9610 | 0.9640 | 0.9670 |
| S1 | S2 | S3 | |
| SUPPORT | 0.9570 | 0.9545 | 0.9525 |
Spot Gold (XAUUSD)
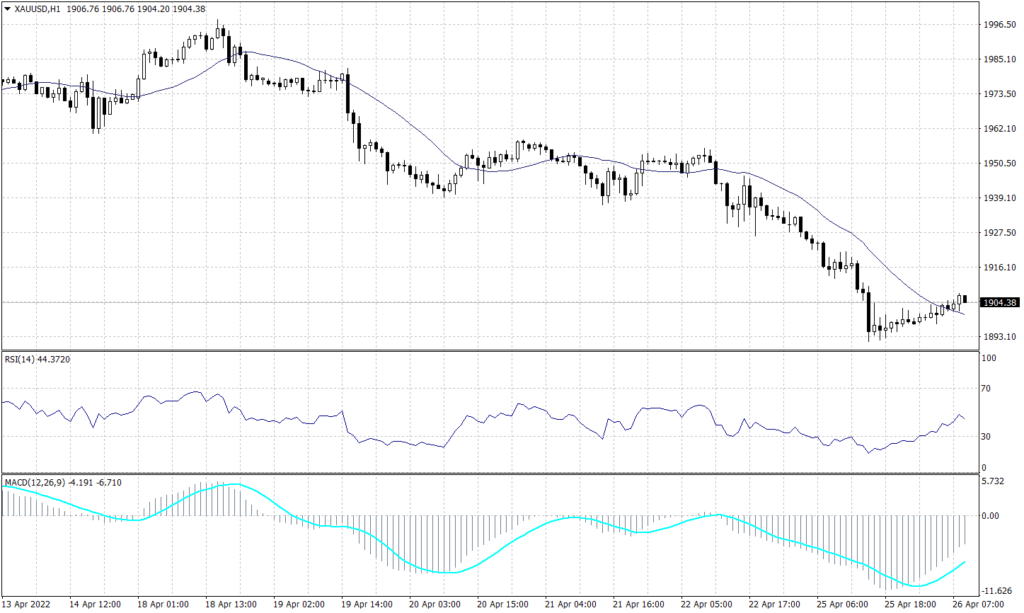
Gold has rallied back from a previous support level of 1,890, which has been held since March 29th. On the hourly chart, the price appears to be making a series of lower lows, and is currently at 1,905, intersecting the 20-candle moving average. Both the RSI and the MACD point to a likely continuation of the downward trend.
PIVOT POINT: 1,905
| R1 | R2 | R3 | |
| RESISTANCE | 1,915 | 1,920 | 1,930 |
| S1 | S2 | S3 | |
| SUPPORT | 1,890 | 1,880 | 1,870 |
WTI (USOUSD)
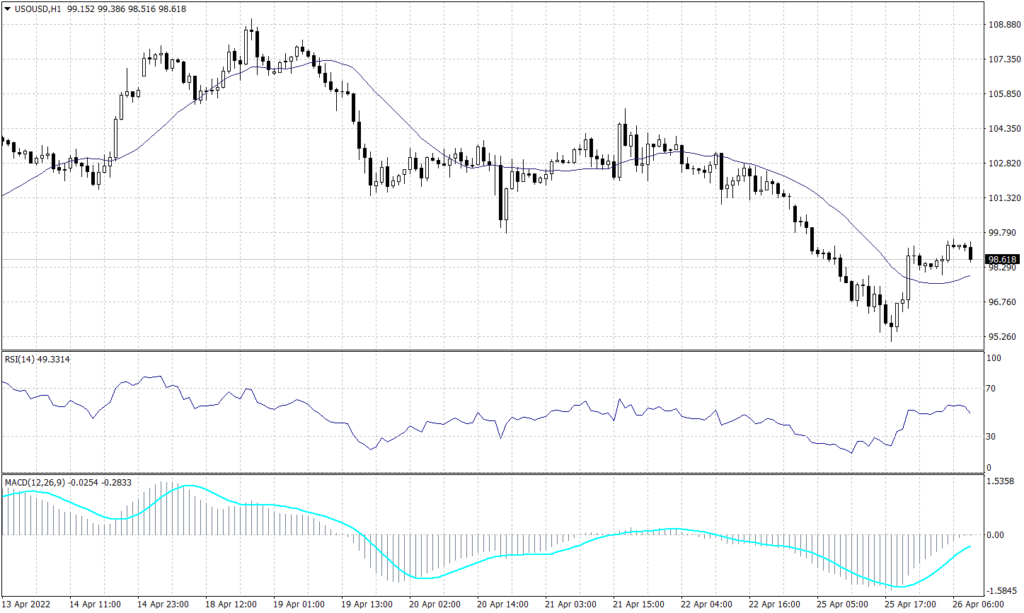
WTI is now trading at $99.70 per barrel. Around the current price of USOUSD from the hourly time frame, there appears to be an intersection between the Fibonacci retracement level of 61.8 and the downward trend line, which might lead to a likely price continuation to the downside. The RSI and MACD both indicate a bearish trend.
PIVOT POINT: 99.70
| R1 | R2 | R3 | |
| RESISTANCE | 101.55 | 102.90 | 104.10 |
| S1 | S2 | S3 | |
| SUPPORT | 97.80 | 96.30 | 94.40 |
Bitcoin (BTCUSD)
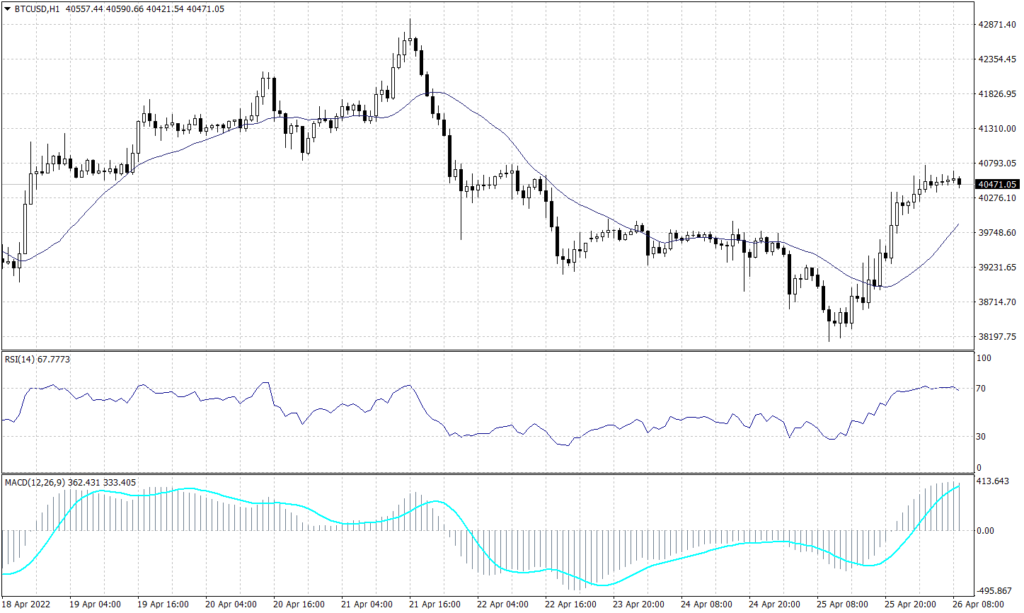
On the daily chart of Bitcoin, a potential bearish flag can be seen, which could lead to a downward trend. After a strong pullback from the support level of 38,140, the hourly chart trend is likewise bearish. The RSI indicates an overbought condition, while the MACD indicates a possible price decline.
PIVOT POINT: 40,605
| R1 | R2 | R3 | |
| RESISTANCE | 41,250 | 41,990 | 42,920 |
| S1 | S2 | S3 | |
| SUPPORT | 39,840 | 39,025 | 38,140 |
Tags
Open Live Account
Please enter a valid country
No results found
No results found
Please enter a valid email
Please enter a valid verification code
1. 8-16 characters + numbers (0-9) 2. blend of letters (A-Z, a-z) 3. special characters (e.g, !a#S%^&)
Please enter the correct format
Please tick the checkbox to proceed
Please tick the checkbox to proceed
Important Notice
STARTRADER does not accept any applications from Australian residents.
To comply with regulatory requirements, clicking the button will redirect you to the STARTRADER website operated by STARTRADER PRIME GLOBAL PTY LTD (ABN 65 156 005 668), an authorized Australian Financial Services Licence holder (AFSL no. 421210) regulated by the Australian Securities and Investments Commission.
CONTINUEImportant Notice for Residents of the United Arab Emirates
In alignment with local regulatory requirements, individuals residing in the United Arab Emirates are requested to proceed via our dedicated regional platform at startrader.ae, which is operated by STARTRADER Global Financial Consultation & Financial Analysis L.L.C.. This entity is licensed by the UAE Capital Market Authority (CMA) under License No. 20200000241, and is authorised to introduce financial services and promote financial products in the UAE.
Please click the "Continue" button below to be redirected.
CONTINUEError! Please try again.

