


market news summary
U.S. CPI hits fresh 40 year high;
A recession is on the horizon;
Fed meeting on Wednesday;
Crude oil demand is seen higher.
U.S. Dollar Index (USDX)
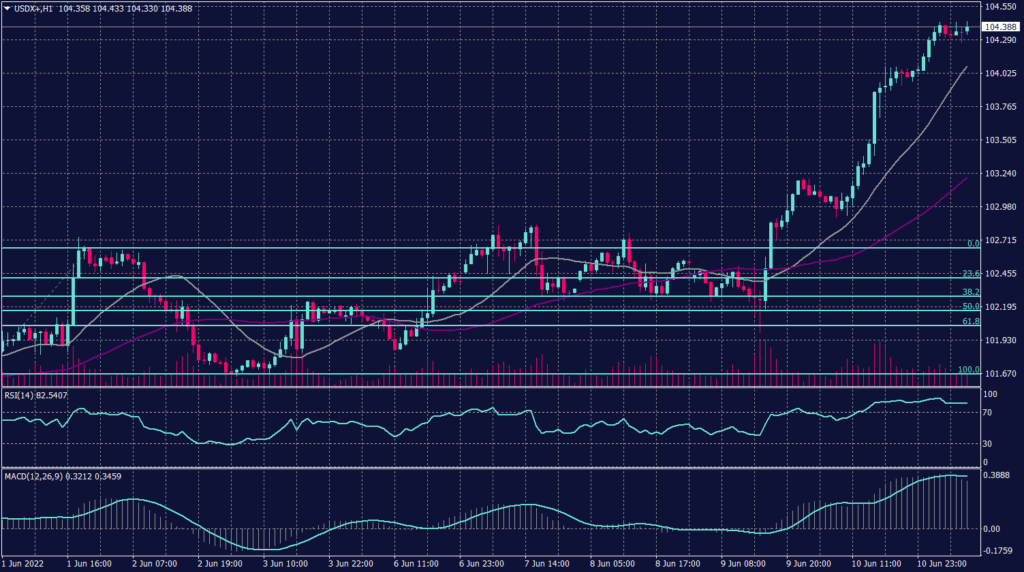
Expectations of a more hawkish Fed are pushing up the dollar against most peers. The dollar index was 0.3% up at 104.52, which is its highest in four weeks.
The benchmark U.S. 10-year yield touched 3.2% on Monday morning. The treasury benchmark gained nearly 12 basis points after U.S. inflation beat expectations. Furthermore, market participants expect the Fed to hike rates even more aggressively.
Technically:
The Dollar trades below the resistance at 104.80 as it recorded its highest in a month at 104.45. Price action shows the index returning to its uptrend on the daily chart, while the moving averages move in a steep slope below the current levels.
However, the hourly chart is showing a possibility of an intra-day decline. On the daily chart, 20 and 55 simple moving averages are moving below the current price levels pointing support formation at 102.60.
PIVOT POINT: 104.40
| SUPPORT | RESISTANCE |
| 104.00 | 104.80 |
| 103.50 | 105.10 |
| 102.60 | 105.60 |
Euro (EURUSD)
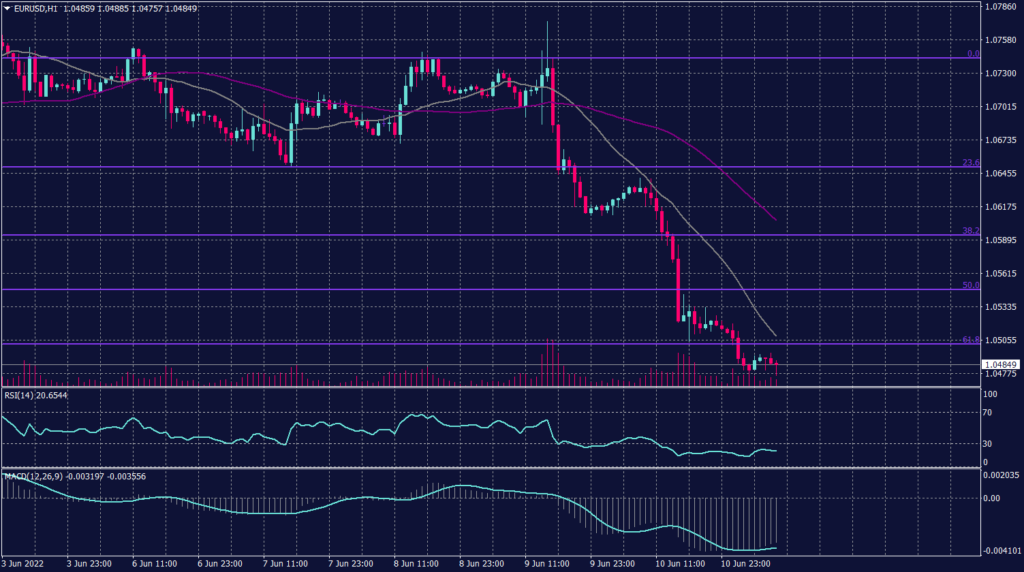
The European currency broke both supports at 1.0550 and 1.0500 after the big gain recorded by the U.S. Dollar amid the inflation data. Furthermore, the EURUSD remains bearish even after touching its lowest rate in a month and it targets 1.0370 on the daily chart.
Fibonacci retracement shows support weak support at 1.0460 but at the same time, this support is not expected to hold. Though, RSI and MACD indicate further decline both in short and long time frames.
PIVOT POINT: 1.0475
| SUPPORT | RESISTANCE |
| 1.0460 | 1.0500 |
| 1.0440 | 1.0550 |
| 1.0370 | 1.0570 |
Japanese Yen (USDJPY)
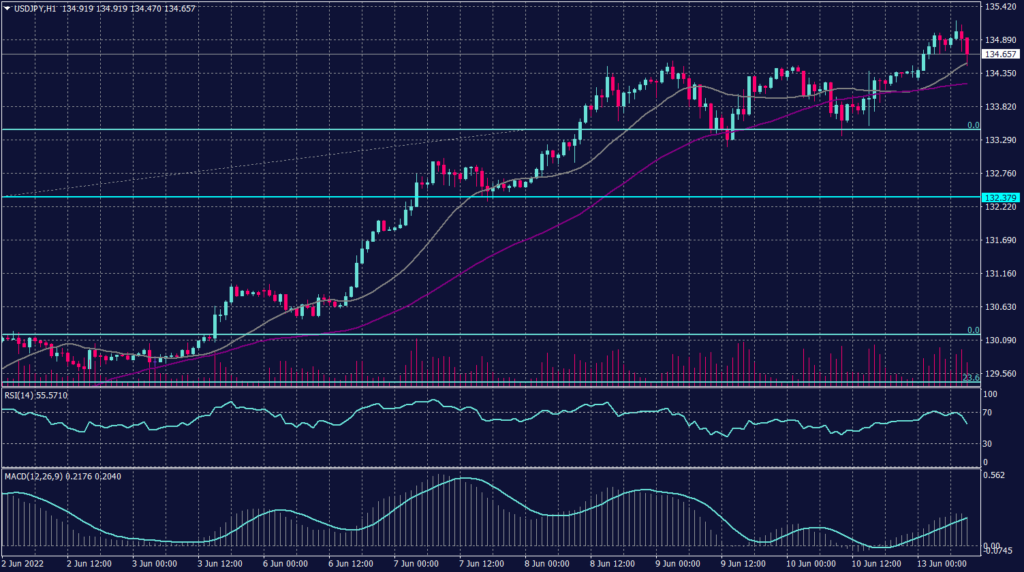
The yen fell to a fresh 20-year low against the dollar during the early trades, as U.S. inflation data pushed up Treasury yields, diminishing the earlier boost from speculation that Japanese authorities could intervene to support the currency. Central banks’ efforts to raise interest rates to curtail inflation will remain in focus this week, while no change is expected from the Bank of Japan.
The yen briefly rallied late on Friday when Japan’s government and the central bank said they were concerned by its recent sharp falls, the news was seen as an unexpected warning that Tokyo could intervene to support the currency.
Technically:
USDJPY pair has reached a fresh 20-year high at 135.19 during the early trades amid huge yen selling activities. The hourly chart shows resistance at the current levels, but the moving averages indicate further advance and support above 134.00.
Technical indicators on the hourly chart show a slight retreat towards 134.35, while it shows a strong advance possibility on the daily chart.
PIVOT POINT: 134.60
| SUPPORT | RESISTANCE |
| 134.30 | 135.00 |
| 133.90 | 135.20 |
| 133.30 | 135.30 |
Spot Gold (XAUUSD)
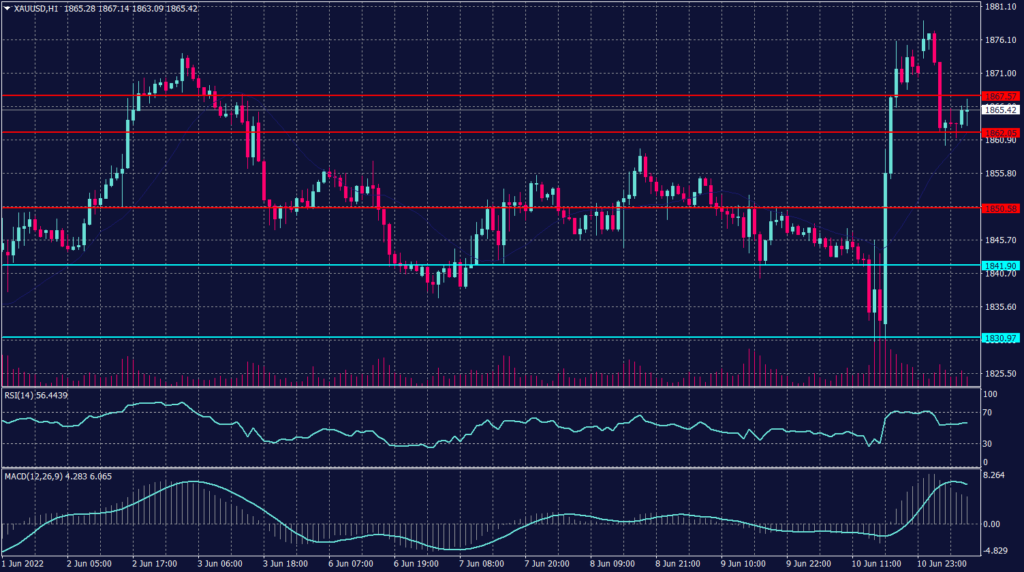
Gold traded down over strengthening U.S. dollars as Friday’s high U.S. inflation data suggested more aggressive monetary tightening. Meanwhile, the Fed will hold June meeting on Wednesday, where market participants expect another 50 basis points increase.
U.S. inflation data Friday showed that the U.S. consumer price index released Friday rose 8.6% in May year-on-year, a fresh 40-year high, increasing investors’ concerns about a recession caused by tightening monetary policies from the U.S. Federal Reserve.
Technically:
The precious metal moved in a range of $50 on Friday amid the CPI data closing at $1,871. However, gold remains in the horizontal channel on the daily chart, while showing unstable gains on the hourly chart. Today, gold declined near the previous support at $1,852. However, spot gold shows a change in direction and signals further decline below the support at 1,852 during the day.
PIVOT POINT: 1,855
| SUPPORT | RESISTANCE |
| 1,852 | 1,866 |
| 1,842 | 1,872 |
| 1,837 | 1,875 |
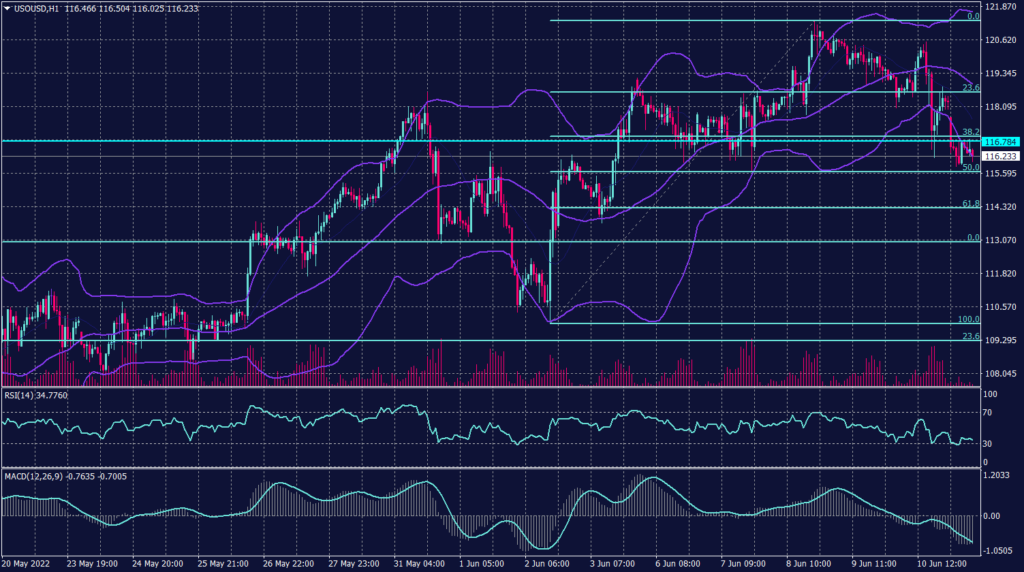
West Texas Crude (USOUSD)
Oil was down on Monday morning in Asia as investors are concerned that the resumption of stringent COVID-19 curbs such as partial lockdowns in Shanghai may hurt fuel demand. The sharp rise in U.S. inflation data and concerns of an intensified monetary tightening weigh on the market. Meanwhile, the U.S. consumer price index released Friday rose 8.6% in May year-on-year, a fresh 40-year high.
Brent oil futures fell 1.37% to $120.34 while WTI futures fell 1.41% to $118.97. Both benchmarks rose more than 1% last week over strong demand in the U.S. and a potential rebound in China as lockdown measures were lifted.
Technically:
WTI remains in the uptrend on the daily chart while forming support above $115 as per the 55 SMA readings. However, WTI is likely to bounce to the same level as the 55 moving average at $118.60. Fibonacci retracement shows firm support at 115. RSI is showing WTI is oversold.
PIVOT POINT: 116.00
| SUPPORT | RESISTANCE |
| 115.00 | 120.00 |
| 109.50 | 122.00 |
| 108.30 | 123.00 |
Tags
Open Live Account
Please enter a valid country
No results found
No results found
Please enter a valid email
Please enter a valid verification code
1. 8-16 characters + numbers (0-9) 2. blend of letters (A-Z, a-z) 3. special characters (e.g, !a#S%^&)
Please enter the correct format
Please tick the checkbox to proceed
Please tick the checkbox to proceed
Important Notice
STARTRADER does not accept any applications from Australian residents.
To comply with regulatory requirements, clicking the button will redirect you to the STARTRADER website operated by STARTRADER PRIME GLOBAL PTY LTD (ABN 65 156 005 668), an authorized Australian Financial Services Licence holder (AFSL no. 421210) regulated by the Australian Securities and Investments Commission.
CONTINUEImportant Notice for Residents of the United Arab Emirates
In alignment with local regulatory requirements, individuals residing in the United Arab Emirates are requested to proceed via our dedicated regional platform at startrader.ae, which is operated by STARTRADER Global Financial Consultation & Financial Analysis L.L.C.. This entity is licensed by the UAE Capital Market Authority (CMA) under License No. 20200000241, and is authorised to introduce financial services and promote financial products in the UAE.
Please click the "Continue" button below to be redirected.
CONTINUEError! Please try again.

