


U.S. Dollar Index (USDX)
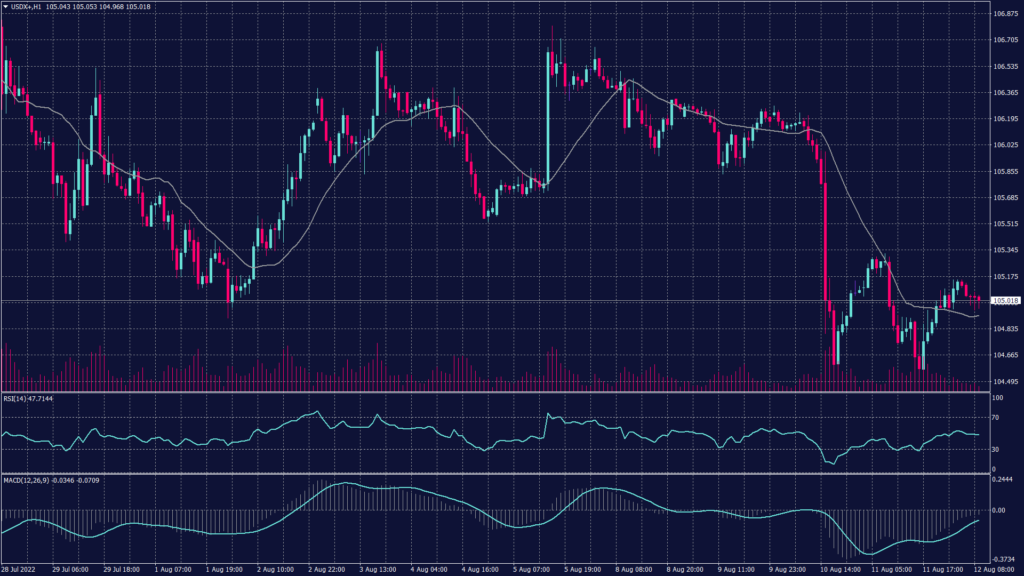
The dollar was slightly lower on Thursday following a 1% loss the previous day when data showed U.S. inflation was not as hot as anticipated in July, prompting traders to dial back future rate hike expectations by the Federal Reserve.
Investors slashed bets on the possibility that the Fed will raise interest rates by 75 basis points for a third consecutive time to help tame decades-high inflation when it meets in September after a report on Wednesday showed U.S. consumer prices were unchanged in July. The dollar recorded its biggest decline in five months following the report as traders readjusted their forecasts to factor in the chance that inflation may have peaked.
Technically:
The index bounced from the support range around 104.50 on the hourly chart and formd a double bottom which led the index to gain towards 105.20. Additionally, technical indicators show a possibility of continuation to the uptrend.
Meanwhile, the daily chart shows three days bouncing above the support at 104.50 but remains negative unless it broke above 105.75.
PIVOT POINT: 105.20
| SUPPORT | RESISTANCE |
| 104.90 | 105.60 |
| 104.30 | 106.00 |
| 103.80 | 106.25 |
Sterling Pound (GBPUSD)
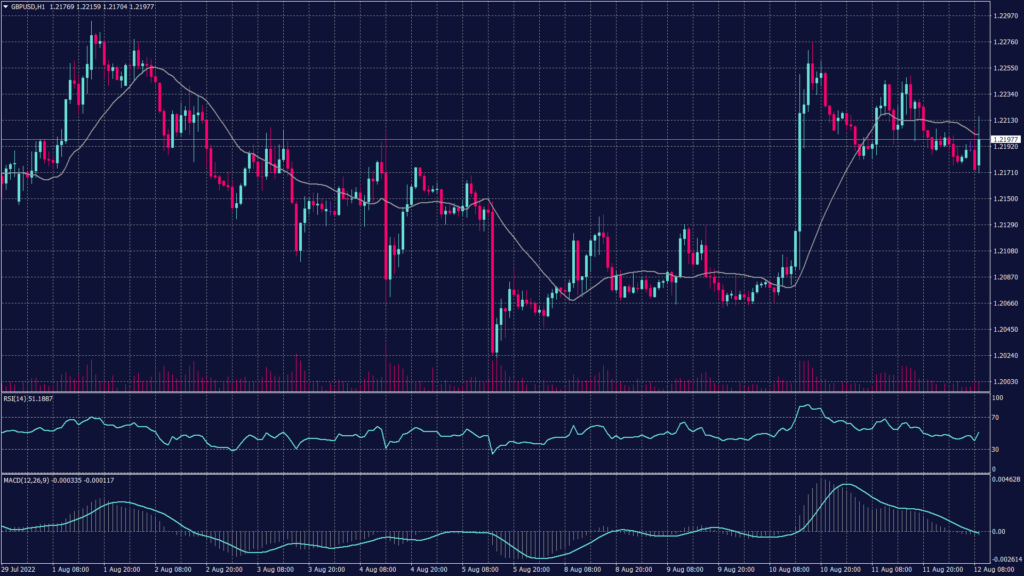
Britain’s economy contracted by 0.6% in monthly terms during June, and by 0.1% between April and June, official data showed on Friday. The Office for National Statistics said services fell by 0.5% in June 2022, which was the main driver of the fall in GDP. June’s slide in economic output had been expected because of an extra bank holiday for Queen Elizabeth’s platinum jubilee celebrations.
The Cable is showing an improvement in the trading patterns but remains in the negative side of the direction on the hourly chart. Meanwhile, the daily chart shows a possibility of forming a double top pattern which signals a probability of a decline and continuation of the downward channel.
PIVOT POINT: 1.2185
| SUPPORT | RESISTANCE |
| 1.2170 | 1.2210 |
| 1.2150 | 1.2240 |
| 1.2100 | 1.2275 |
Spot Gold (XAUUSD)
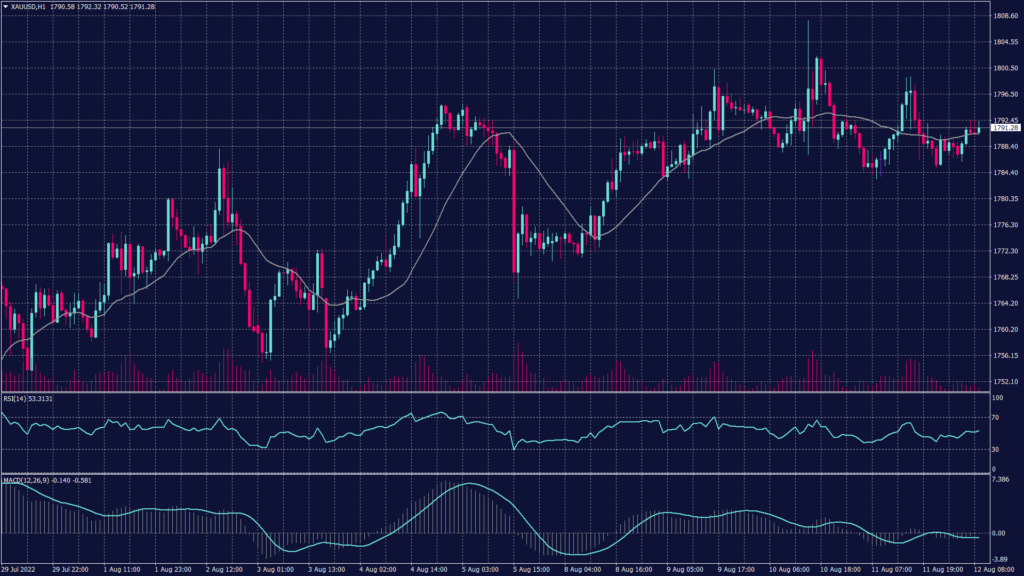
Gold prices retreated on Friday, as hawkish comments on interest rate hikes by the Federal Reserve outweighed optimism over signs of cooling U.S. inflation. Spot gold was down 0.1% at $1,788.13 an ounce, while gold futures held around $1,803.50. Still, both instruments were set for mild gains this week, marked by a sharp fall in the dollar.
The precious metal remains committed to the daily chart’s downtrend and will remain so unless it broke above the channel at 1,800. Meanwhile, the hourly chart shows slight support above 1,780 but remains to indicate a downward movement towards 1,770.
Technical indicators signal an intense fluctuation between 1,770 and 1,788 but both RSI and MACD support the theory of going back below 1,770.
PIVOT POINT: 1,790
| SUPPORT | RESISTANCE |
| 1,770 | 1,800 |
| 1,767 | 1,810 |
| 1,759 | 1,825 |
West Texas Crude (USOUSD)
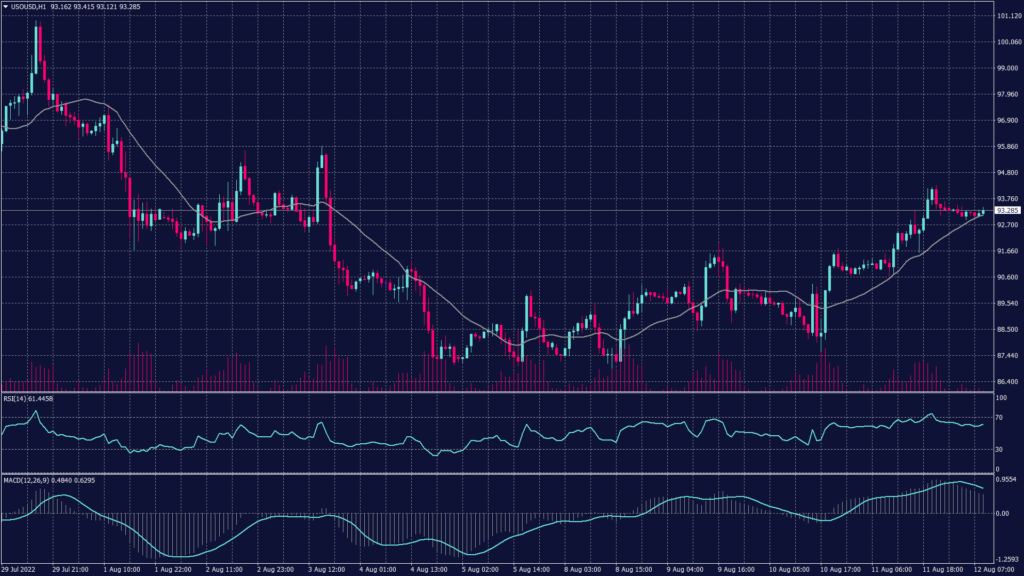
Oil prices were neutral on Friday but were headed for strong weekly gains on the back of easing inflation risks, a strong demand forecast, and the prospect of OPEC supply cuts.
Brent oil futures rose 0.1% in early Asia trade to $99.38 a barrel, while U.S. crude oil WTI futures fell 0.3% to $94.08 a barrel. Both contracts had surged over 2% on Thursday and were set to end the week between 4% to 5% higher. Oil’s biggest boost this week was data on Wednesday that showed U.S. CPI inflation grew less than expected in July, pointing to a smaller rate hike by the Federal Reserve.
WTI is moving higher on the daily candle but remains in the declining despite the bounce from the support at $87.50 per barrel.
PIVOT POINT: 93.80
| SUPPORT | RESISTANCE |
| 92.70 | 92.50 |
| 92.50 | 92.75 |
| 91.60 | 93.80 |
Tags
Open Live Account
Please enter a valid country
No results found
No results found
Please enter a valid email
Please enter a valid verification code
1. 8-16 characters + numbers (0-9) 2. blend of letters (A-Z, a-z) 3. special characters (e.g, !a#S%^&)
Please enter the correct format
Please tick the checkbox to proceed
Please tick the checkbox to proceed
Important Notice
STARTRADER does not accept any applications from Australian residents.
To comply with regulatory requirements, clicking the button will redirect you to the STARTRADER website operated by STARTRADER PRIME GLOBAL PTY LTD (ABN 65 156 005 668), an authorized Australian Financial Services Licence holder (AFSL no. 421210) regulated by the Australian Securities and Investments Commission.
CONTINUEImportant Notice for Residents of the United Arab Emirates
In alignment with local regulatory requirements, individuals residing in the United Arab Emirates are requested to proceed via our dedicated regional platform at startrader.ae, which is operated by STARTRADER Global Financial Consultation & Financial Analysis L.L.C.. This entity is licensed by the UAE Capital Market Authority (CMA) under License No. 20200000241, and is authorised to introduce financial services and promote financial products in the UAE.
Please click the "Continue" button below to be redirected.
CONTINUEError! Please try again.

