


market news summary
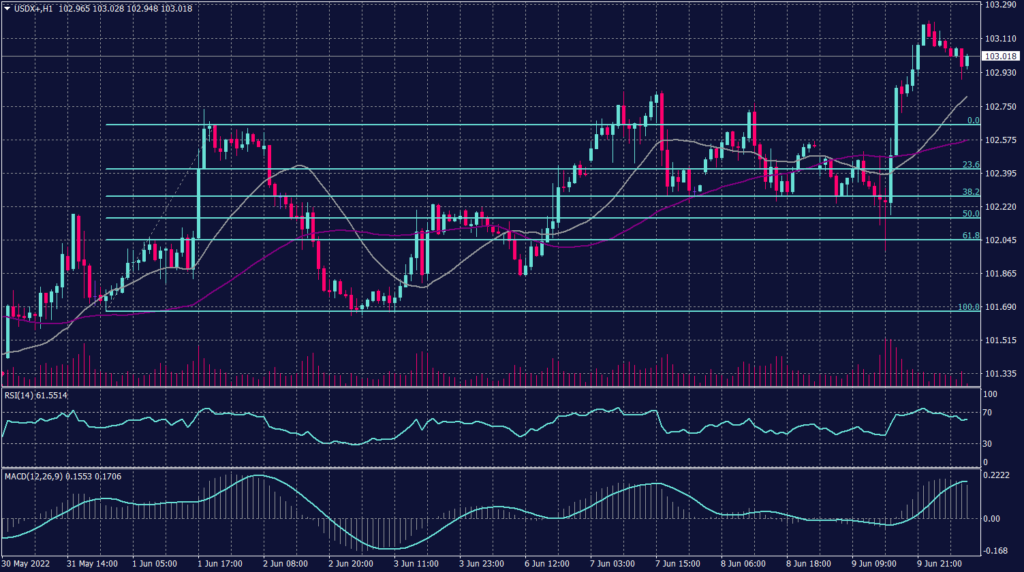
U.S. Dollar Index (USDX)
Market participants will focus on the US inflation data today as the next test for markets. The figures will provide clues about how efficient the Federal Reserve policy is and how aggressive it should be. Experts expect the data to show annual consumer-price gains of more than 8.4%.
In the nearer term, markets expect the Fed next week to announce the second of its three consecutive 50-basis-point interest rate hikes, which has boosted the dollar in recent months. Two-thirds of respondents to a Reuters poll of analysts expected a further 25 basis point hike in September.
Technically:
The U.S. Dollar index returns to its rising channel on the daily chart but remains bearish on the long term. However, the hourly chart is showing a possibility of an intra-day decline. The U.S. Dollar index has penetrated the resistance at 102.60 to hit 103.20 this morning before easing to 102.90.
On the hourly chart, 20 and 55 simple moving averages are moving below the current price levels pointing support formation at 102.60.
PIVOT POINT: 102.40
| SUPPORT | RESISTANCE |
| 103.00 | 102.20 |
| 102.50 | 103.40 |
| 101.30 | 103.50 |
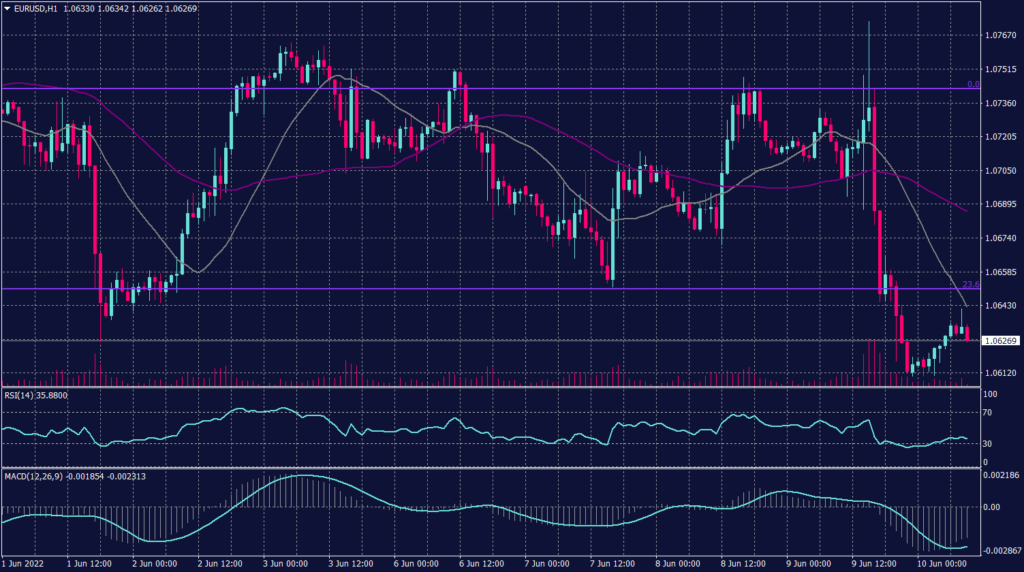
Euro (EURUSD)
The European Central Bank declared that it would end quantitative easing (APP) on July 1. However, the ECB will not touch interest rates until the next meeting where they might raise interest rates by 25 basis points. Additionally, the ECB flagged a higher rate increase in September unless the inflation outlook improves in the interim period.
Technically:
The Euro remains bearish on both daily and hourly charts as it touched the support at 1.0610 due to the high selling pressure. The European currency found breathing room as the U.S. Dollar eased its gains but moving averages confirm further decline.
Fibonacci retracement shows support at 1.0550 on the daily chart, on the other hand, technical indicators show a possibility of a decline. Though, RSI and MACD indicate further decline both on short and long time frames.
PIVOT POINT: 1.0610
| SUPPORT | RESISTANCE |
| 1.0590 | 1.0680 |
| 1.0550 | 1.0740 |
| 1.0500 | 1.0780 |
Japanese Yen (USDJPY)
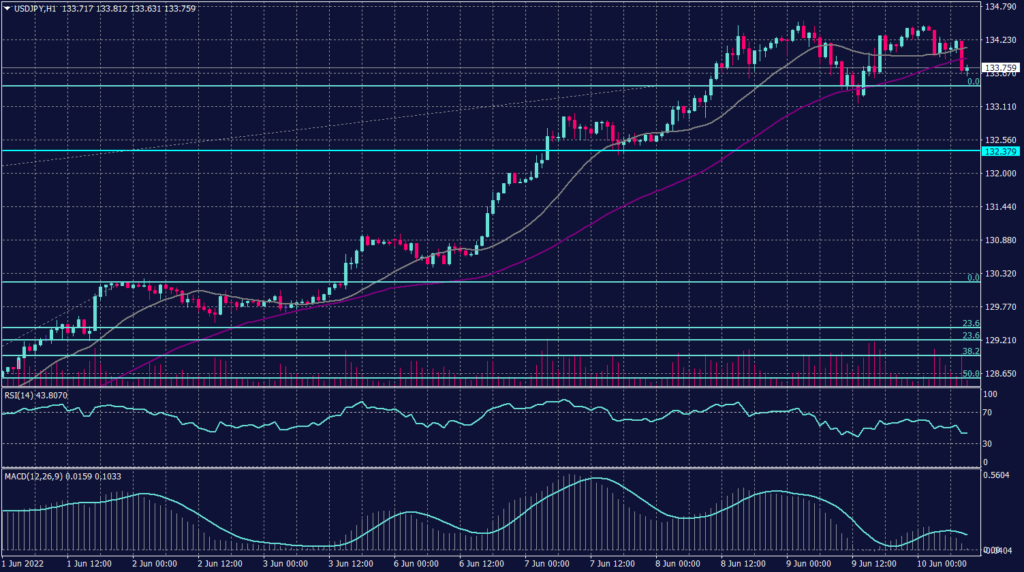
The USDJPY pair fell 0.40% to 133.79 this morning as the U.S. slowed prior to the inflation data. However, on the daily chart, the USDJPY is a continuation of the current uptrend, while technical indicators show a slowdown. Though, Technical indicators on both the hourly and the daily charts are easing and signaling further advance.
PIVOT POINT: 133.50
| SUPPORT | RESISTANCE |
| 132.00 | 134.20 |
| 130.00 | 134.50 |
| 127.00 | 135.20 |
Spot Gold (XAUUSD)
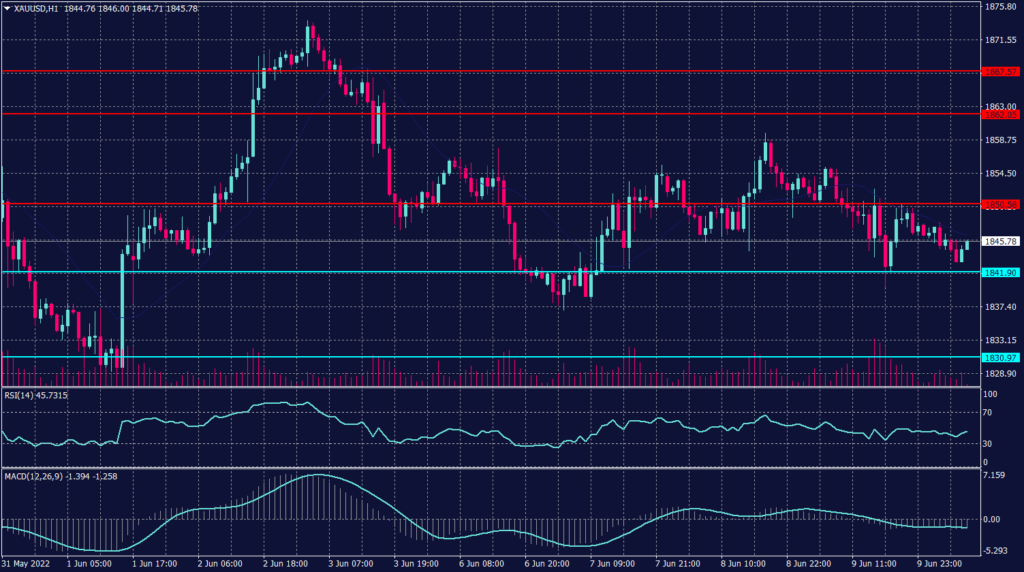
Gold traded lower during the Asian sessions as U.S. Treasury yields rose. Moreover, investors will be eying the U.S. inflation data for more clues on Fed’s interest rate hike plan. Gold futures were down 0.32% to $1,846.85, while benchmark U.S. 10-year Treasury yields edged up, denting demand for gold.
Likewise, other metals traded lower this morning as silver fell 0.74%, Platinum was down 0.45%, and palladium gained 0.5%.
Technically:
The yellow metal traded lower and formed a bearish pattern below 1,854 and showed a tendency to form a resistance below the previous support of 1,852. Gold prices are set for a decline towards 1,810 on the daily chart. Meanwhile, in the hourly chart, spot gold penetrated out of the regression channel, but it remains set to decline.
On the daily chart, the precious metal returns to its primary decline trend targeting the resistance at 1,810 and 1,790. However, spot gold shows a change in direction and signals further decline below the support at 1,842 during the day.
PIVOT POINT: 1,850
| SUPPORT | RESISTANCE |
| 1,842 | 1,866 |
| 1,837 | 1,872 |
| 1,830 | 1,875 |
West Texas Crude (USOUSD)
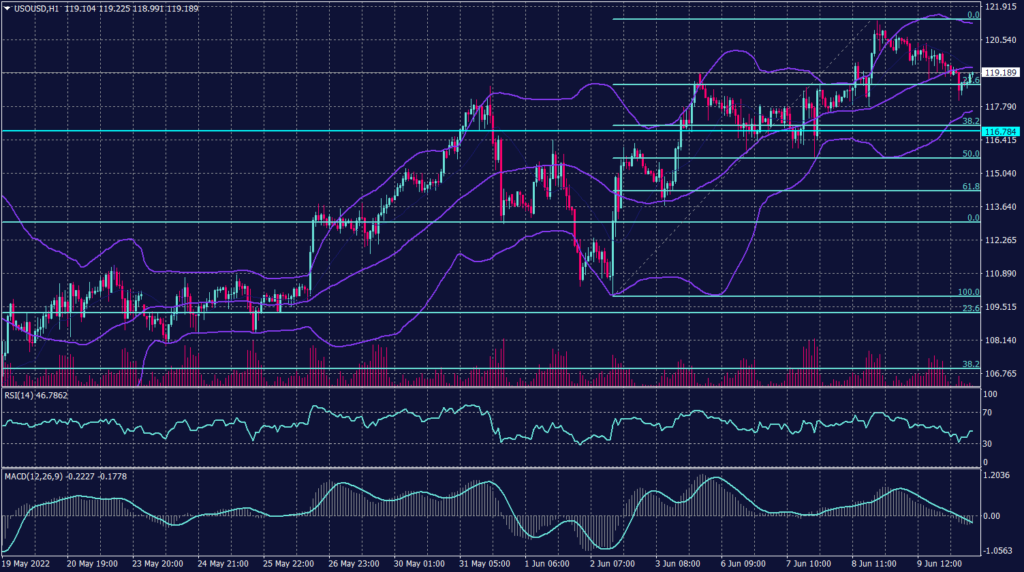
Oil prices rally could accelerate with China’s biggest driller betting on a demand rebound if lockdowns ease as the US summer driving season starts. Crude oil consumption in China could jump 12% in the third quarter compared with the second, according to China National Petroleum Corp. That comes at a time when the world’s largest consumer, the US, hits its peak demand season. However, OPEC+ struggles to raise output as many buyers shunning Russian supplies.
Brent crude futures for August were down 0.6% at $122.30 a barrel after a 0.4% decline the previous day. U.S. West Texas Intermediate crude for July fell 0.6% to $120.79 a barrel, having dropped 0.5% on Thursday.
Technically:
As mentioned yesterday, WTI broke the resistance at $118 to trade above $122 before retreating towards $120 a barrel. WTI remains in the uptrend on the daily chart targeting $125 a barrel while forming support above $118.60 as per the 55 SMA readings.
However, today WTI is likely to swing to the same level as the 55 moving average at $118.60. Fibonacci retracement shows firm support at 115. RSI is showing WTI is oversold.
PIVOT POINT: 118.60
| SUPPORT | RESISTANCE |
| 115.00 | 120.00 |
| 109.50 | 122.00 |
| 108.30 | 123.00 |
Tags
Open Live Account
Please enter a valid country
No results found
No results found
Please enter a valid email
Please enter a valid verification code
1. 8-16 characters + numbers (0-9) 2. blend of letters (A-Z, a-z) 3. special characters (e.g, !a#S%^&)
Please enter the correct format
Please tick the checkbox to proceed
Please tick the checkbox to proceed
Important Notice
STARTRADER does not accept any applications from Australian residents.
To comply with regulatory requirements, clicking the button will redirect you to the STARTRADER website operated by STARTRADER PRIME GLOBAL PTY LTD (ABN 65 156 005 668), an authorized Australian Financial Services Licence holder (AFSL no. 421210) regulated by the Australian Securities and Investments Commission.
CONTINUEImportant Notice for Residents of the United Arab Emirates
In alignment with local regulatory requirements, individuals residing in the United Arab Emirates are requested to proceed via our dedicated regional platform at startrader.ae, which is operated by STARTRADER Global Financial Consultation & Financial Analysis L.L.C.. This entity is licensed by the UAE Capital Market Authority (CMA) under License No. 20200000241, and is authorised to introduce financial services and promote financial products in the UAE.
Please click the "Continue" button below to be redirected.
CONTINUEError! Please try again.

