


What Are Fibonacci Levels? What Do They Tell You?
Fibonacci levels, named after the renowned Italian mathematician Leonardo Pisano, also known as Fibonacci, are horizontal lines utilized in financial markets to indicate potential support and resistance levels. Each level is linked to a specific percentage, reflecting the degree of price retracement from a previous movement. These levels consist of 23.6%, 38.2%, 61.8%, and 78.6%, with an informal addition at 50%. Traders find these levels crucial as they can draw them between significant price points, like highs and lows, facilitating the identification of potential reversal areas.
The General Formula and Calculation of Fibonacci
–Calculation of Fibonacci
To begin with, the general formula for calculating Fibonacci levels is based on the Fibonacci sequence, which is a series of numbers that starts with 0 and 1, and each subsequent number is the sum of the two previous ones. The formula is as follows:
F(0) = 0
F(1) = 1
F(n) = F(n-1) + F(n-2) for n > 1
In this formula:
F(n) represents the number that appears at position n in the Fibonacci sequence.
F(0) equals 0.
F(1) equals 1.
We calculate F(n) by adding the two preceding numbers, F(n-1) and F(n-2), to get the next number in the sequence.
Let’s summarize the first few Fibonacci numbers:
F(0) = 0
F(1) = 1
F(2) = F(1) + F(0) = 1 + 0 = 1
F(3) = F(2) + F(1) = 1 + 1 = 2
F(4) = F(3) + F(2) = 2 + 1 = 3
F(5) = F(4) + F(3) = 3 + 2 = 5
And the sequence continues indefinitely:
0, 1, 1, 2, 3, 5, 8, 13, 21, 34, 55, 89, 144, 233, 377, 610, and so on…
This sequence goes on forever, and people can calculate any subsequent Fibonacci number by adding the two preceding numbers.
–The Ratios of the Fibonacci Sequence
At first glance, this arithmetic sequence appears to be natural until discovering the fascinating relationship between consecutive numbers. It is worth noting that the results of this process apply to all arithmetic sequences, regardless of their form, and yield the same outcome in their simplest form.
In fact, this relationship has been found in various aspects of human life, aesthetic concepts, and even in the smallest parts of the human body, such as chromosomes, which are essential for human existence. It has also been observed in the largest galaxies in the universe and in nature.
The arithmetic process is simply dividing a number by the number preceding or following it, as follows:
0, 1, 1, 2, 3, 5, 8, 13, 21, 34, 55, 89, 144, 233, 377, 610
610 / 377 = 1.618
233 / 144 = 1.618
89 / 55 = 1.618
From the above, we find the constant between each number and its preceding number, which is 1.618.
What if we reverse the arithmetic process so that the preceding number is divided by the following number:
0, 1, 1, 2, 3, 5, 8, 13, 21, 34, 55, 89, 144, 233, 377, 610 ………
377 / 610 = 61.8
89 / 144 = 61.8
144 / 233 = 61.8
Through this reversal of the process, we also find a constant number representing 61.8.
• What if we divide a number from the sequence by the number preceding it, as follows:
610 / 233 = 2.618
144 / 55 = 2.618
89 / 34 = 2.618
The result is also a constant value of 2.618.
So, we find that the number has changed from 1.618 to 2.618, where the change from 1 to 2 represents the difference in values between the divided numbers.
If we reverse the division process, the result is 38.2.
And if we divide a number by the preceding number with a difference of two decimal places, we find that the result is 4.236, as follows:
610 / 144 = 4.236
233 / 55 = 4.236
Similarly, if we reverse the division, the result is 0.236:
144 / 610 = 0.236
55 / 233 = 0.236
From the above, we deduce that dividing any term in a Fibonacci sequence by the previous term results in a constant value that never changes. This value is known as the golden ratio and its constants.
0.236
0.382
0.618
1.618
2.618
4.236
Using Fibonacci Levels in Trading
Fibonacci levels can be used as robust technical analysis tools that help investors better understand market behaviors. In fact, they can be utilized to grasp the movements and changes of various instruments and timeframes, identifying potential support and resistance levels as well.
Because market events are shaped by the interplay of time and price movements, they give rise to specific patterns. As these price movements are not random, they have predictable outcomes. This stability in outcomes is why Fibonacci numbers are used in mathematical calculations, as mentioned earlier. But what does each Fibonacci number represent?
-Understanding the mathematical relationship
Before exploring the significance of each number, it’s essential to understand the mathematical relationship between the results of the preceding numbers.
423.6 … 261.8 … 161.8 … 61.8 … 38.2 … 23.6
If we divide these numbers by each other, we will get the same outputs as the previous operations as follows:
23.6 / 38.2 = 0.618
38.2 / 23.6 = 1.618
423.6 / 261.8 = 1.618
38.2 / 23.6 = 1.618
Upon observation, we discover that the results of the mathematical operations for the sequence remain consistent with the initial results. Through these calculations, we encounter a remarkable stability in the outcomes of the arithmetic sequences, famously referred to as the Golden Ratio: 61.8 and 161.8.
The Golden Ratio, represented by 61.8 and 161.8, holds significant meaning in arithmetic sequences. These numbers result from dividing consecutive elements in the sequence and their inverse operation. Within a restricted price movement from 0% to 100%, we find ratios of 23.6%, 38.2%, and 61.8%, all contained within the full range.
However, there are numbers like 161.8%, 261.8%, and 423.6% that go beyond the 100% level. These figures are known as price extensions, indicating potential price levels the market may reach after breaking out of a specific price movement for a designated period, extending beyond the defined 0% to 100% range.
–Setting up and applying Fibonacci levels
In general, there are several methods of using Fibonacci levels, and traders can employ all of them. Some examples include Fibonacci channels, fans, and more. However, it is generally better to utilize Fibonacci Retracement levels. This involves drawing a line between the peak and trough (highest and lowest price areas) over a specific time period to identify critical support and resistance zones.
To apply Fibonacci Retracement levels on the MetaTrader 4 platform, follow these two steps:
1- Firstly, you can find the “Draw Fibonacci Retracement” option in the toolbar at the top of the platform as follows:
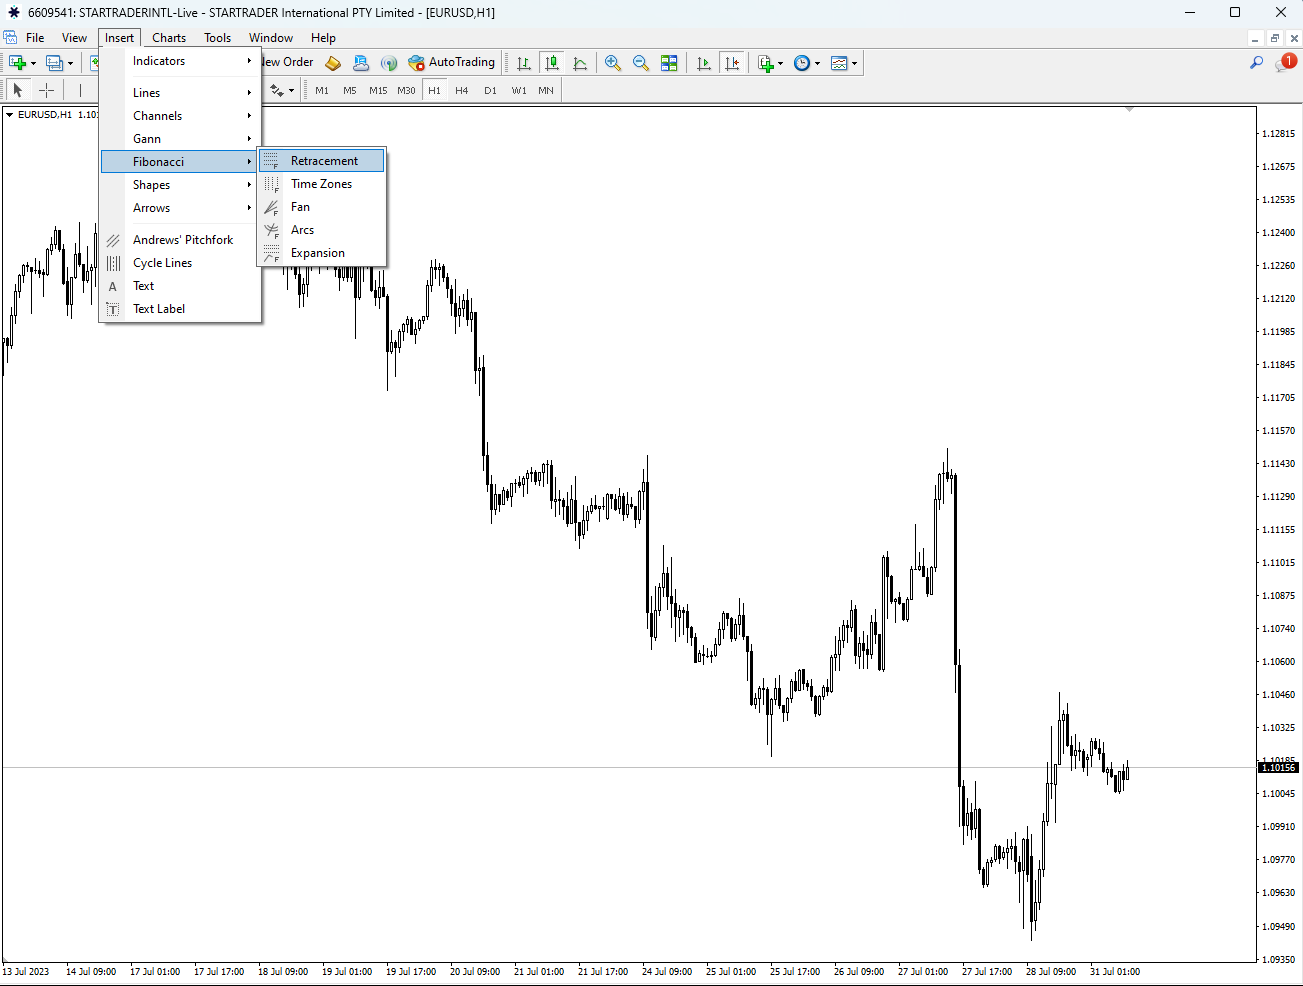
2- From the “Insert” menu on the top toolbar of the platform, you will find the “Fibonacci” option, then select “Retracement” as follows:
How Traders Can USE Fibonacci Levels
- Fibonacci levels help identify potential support and resistance areas in the market. Traders can use these levels to determine possible entry and exit points for their trades.
- Fibonacci levels also provide significant time ratios that traders can use for time projections of price movements and identifying potential extension and reversal periods.
- When a potential price reversal aligns with important Fibonacci levels, it can increase traders’ confidence in their decisions.
- Due to their popularity and widespread use in trading, both beginner and experienced traders can benefit from Fibonacci levels.
Disadvantages of Fibonacci Levels
Although traders commonly refer to them, Fibonacci levels have some downsides that the investors need to be aware of so that they can navigate them more effectively.
- First, some traders may find it challenging to understand and use Fibonacci levels correctly.
- These levels require continuous learning and practice, as it relies on historical price analysis.
- Moreover, Fibonacci levels may not always be accurate, especially in rapidly changing markets.
- Additionally, they can provide signals about potential trend changes or reversals.
- However, they may not always confirm these signals.
- Finally, Traders should rely on other indicators and additional technical analysis to validate the signals.
Tags
Open Live Account
Please enter a valid country
No results found
No results found
Please enter a valid email
Please enter a valid verification code
1. 8-16 characters + numbers (0-9) 2. blend of letters (A-Z, a-z) 3. special characters (e.g, !a#S%^&)
Please enter the correct format
Please tick the checkbox to proceed
Please tick the checkbox to proceed
Important Notice
STARTRADER does not accept any applications from Australian residents.
To comply with regulatory requirements, clicking the button will redirect you to the STARTRADER website operated by STARTRADER PRIME GLOBAL PTY LTD (ABN 65 156 005 668), an authorized Australian Financial Services Licence holder (AFSL no. 421210) regulated by the Australian Securities and Investments Commission.
CONTINUEImportant Notice for Residents of the United Arab Emirates
In alignment with local regulatory requirements, individuals residing in the United Arab Emirates are requested to proceed via our dedicated regional platform at startrader.ae, which is operated by STARTRADER Global Financial Consultation & Financial Analysis L.L.C.. This entity is licensed by the UAE Capital Market Authority (CMA) under License No. 20200000241, and is authorised to introduce financial services and promote financial products in the UAE.
Please click the "Continue" button below to be redirected.
CONTINUEError! Please try again.

